AFFO and FFO Explained: The REIT Metrics That Matter Most
Funds from operations (FFO) and adjusted funds from operations (AFFO) are the two numbers that tell you what a REIT actually earns. FFO is net income with real estate depreciation added back and gains from property sales taken out. AFFO goes further and subtracts the money a REIT has to spend to keep its buildings leased.
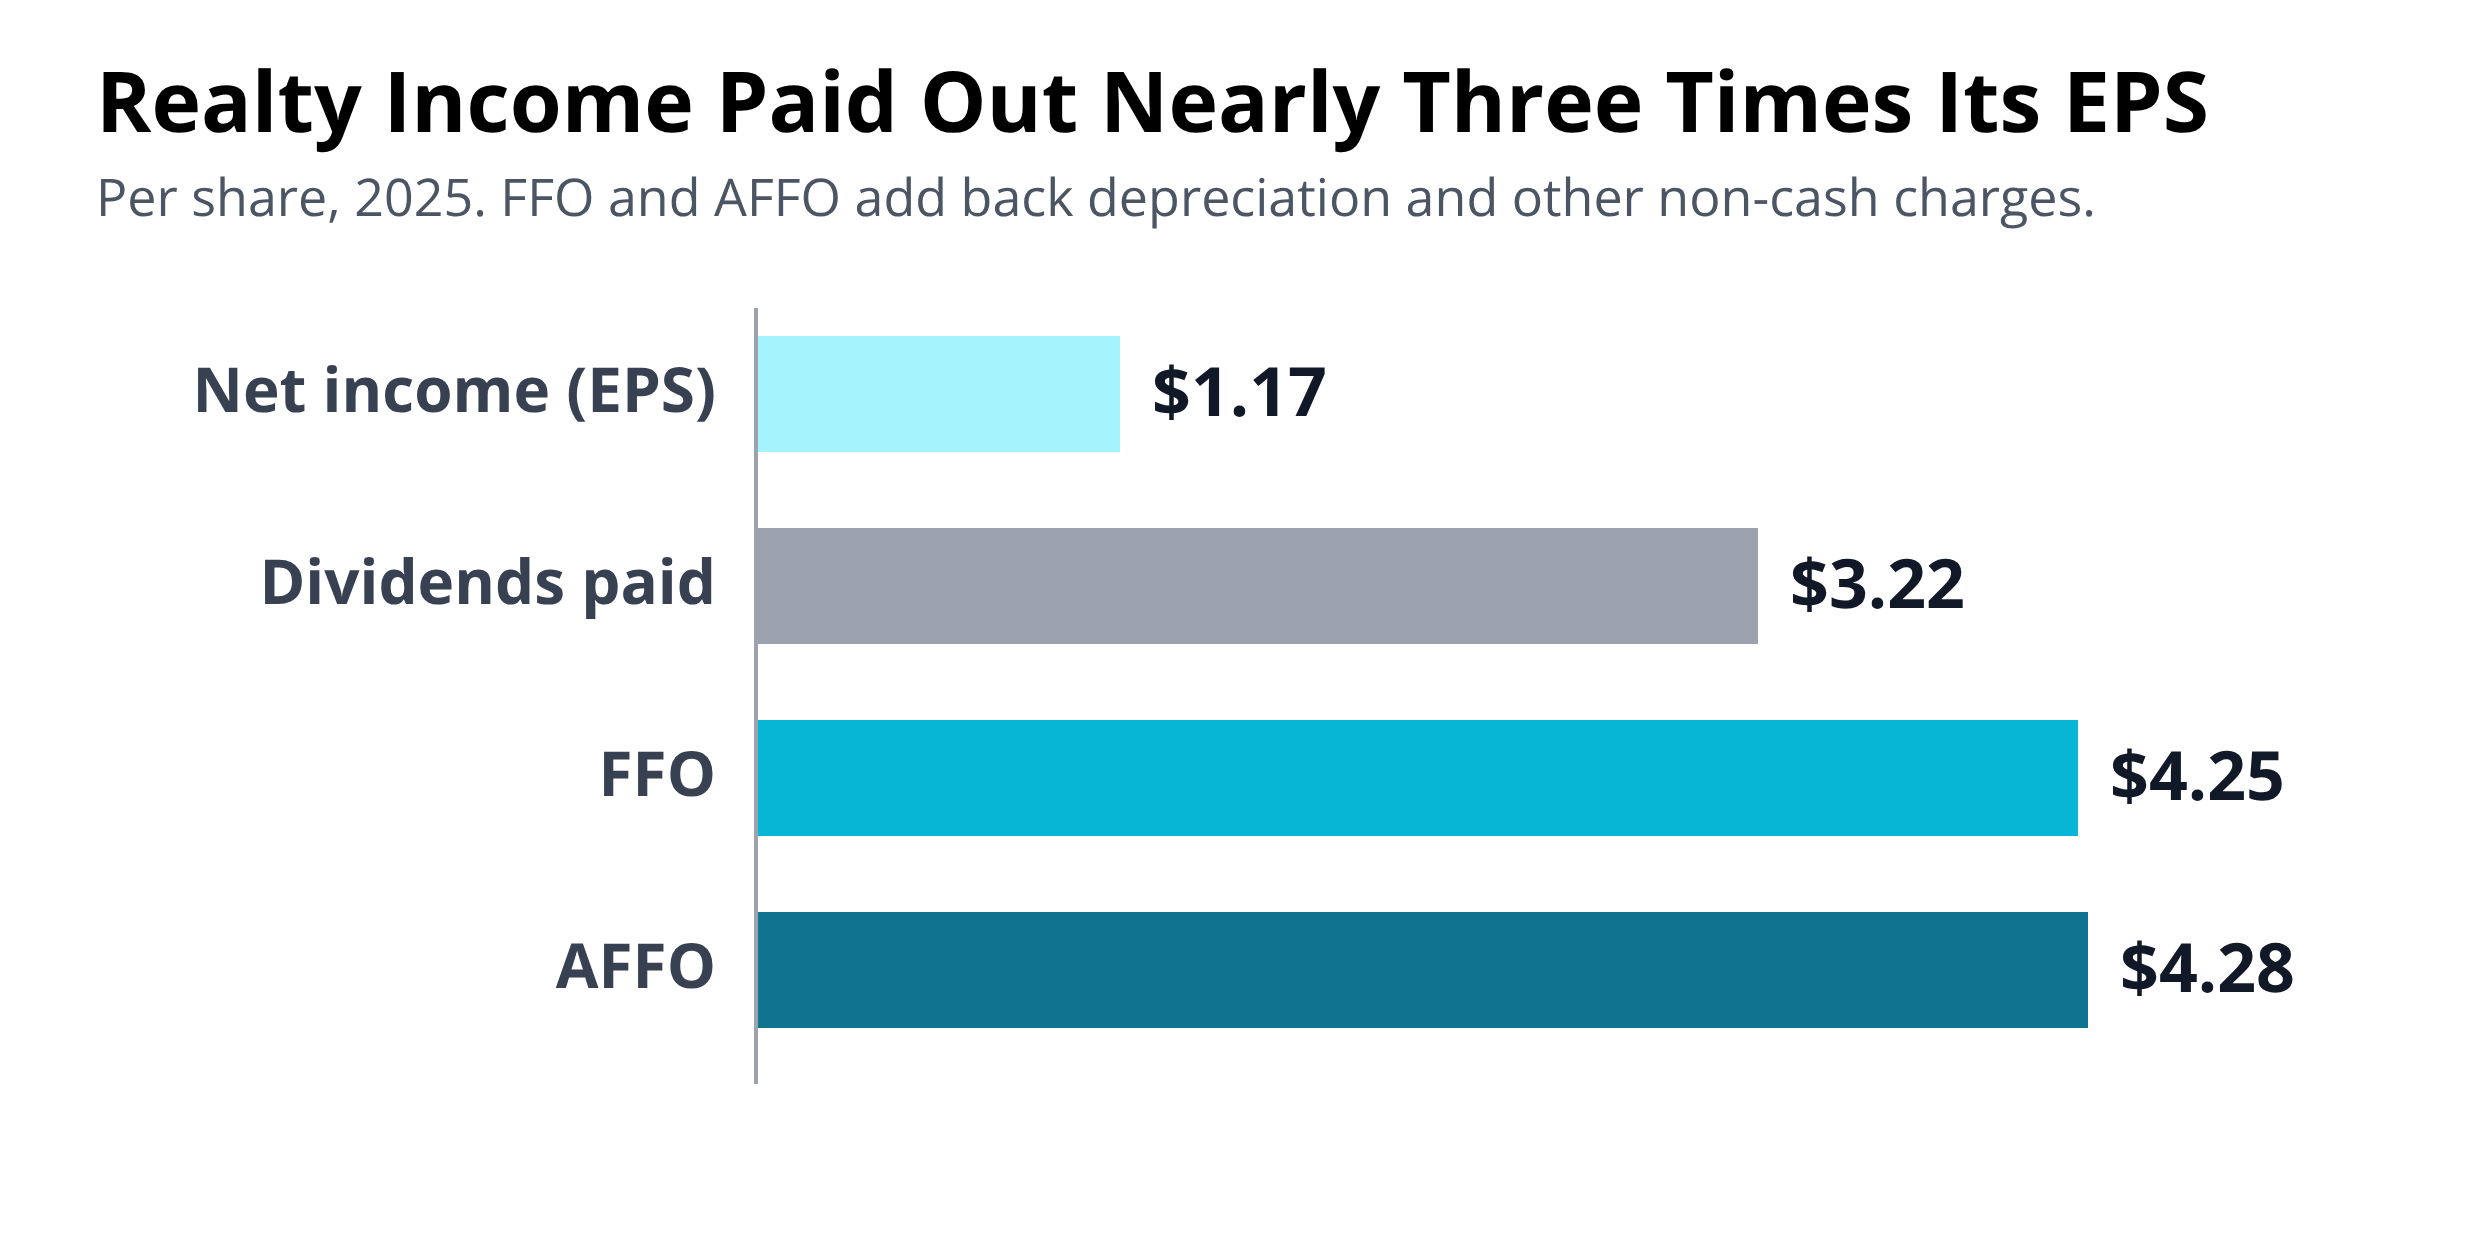
Those adjustments matter because a REIT's reported earnings can badly understate its cash flow. Realty Income (O) earned $1.17 per share in 2025 but generated $4.28 per share of AFFO, which covered its $3.22 per share dividend with room to spare.
Once you have AFFO, three more measures do most of the work: the AFFO payout ratio for dividend safety, net debt to EBITDA for the balance sheet, and price to AFFO for valuation.
Why Earnings Per Share Misleads for REITs
Accounting rules make a company spread the cost of a building over its useful life as depreciation, a non-cash expense charged against earnings every year. For most businesses that's a fair way to account for equipment that wears out.
Well-kept real estate often holds its value or rises over time, though, and REITs own a lot of it. Realty Income recorded $2.52 billion of depreciation and amortization in 2025, equal to 44% of its revenue and about $2.78 per share.
That charge is why its earnings per share of $1.17 sat far below the $3.22 per share it paid in dividends. Judged on earnings, the payout ratio was about 275%, which would point to a dividend cut. Judged on AFFO, it was 75%, and Realty Income raised its dividend again in 2025.
What Is FFO (Funds From Operations)?
FFO was created by Nareit, the REIT industry's trade group, to give investors a common measure of operating performance that strips out the distortion from depreciation.
Here is the formula, in the form Realty Income says follows Nareit's definition:
- Net income available to common shareholders
- Plus depreciation and amortization of real estate
- Plus impairments of depreciable real estate
- Minus gains from property sales
Gains on sales come out because selling buildings is not part of collecting rent, and a REIT that sold properties to hit its numbers would otherwise look healthier than it is. Divide by diluted shares to get FFO per share. Realty Income's was $4.25 in 2025.
FFO is not the same as cash flow, and REITs say so in their own filings. It ignores what a landlord spends to keep its properties competitive, which is where AFFO comes in.
What Is AFFO (Adjusted Funds From Operations)?
AFFO is FFO adjusted to look more like the cash a REIT has left over to pay dividends. It's the closest thing a REIT has to free cash flow, and it's the measure we use to judge a REIT's dividend.
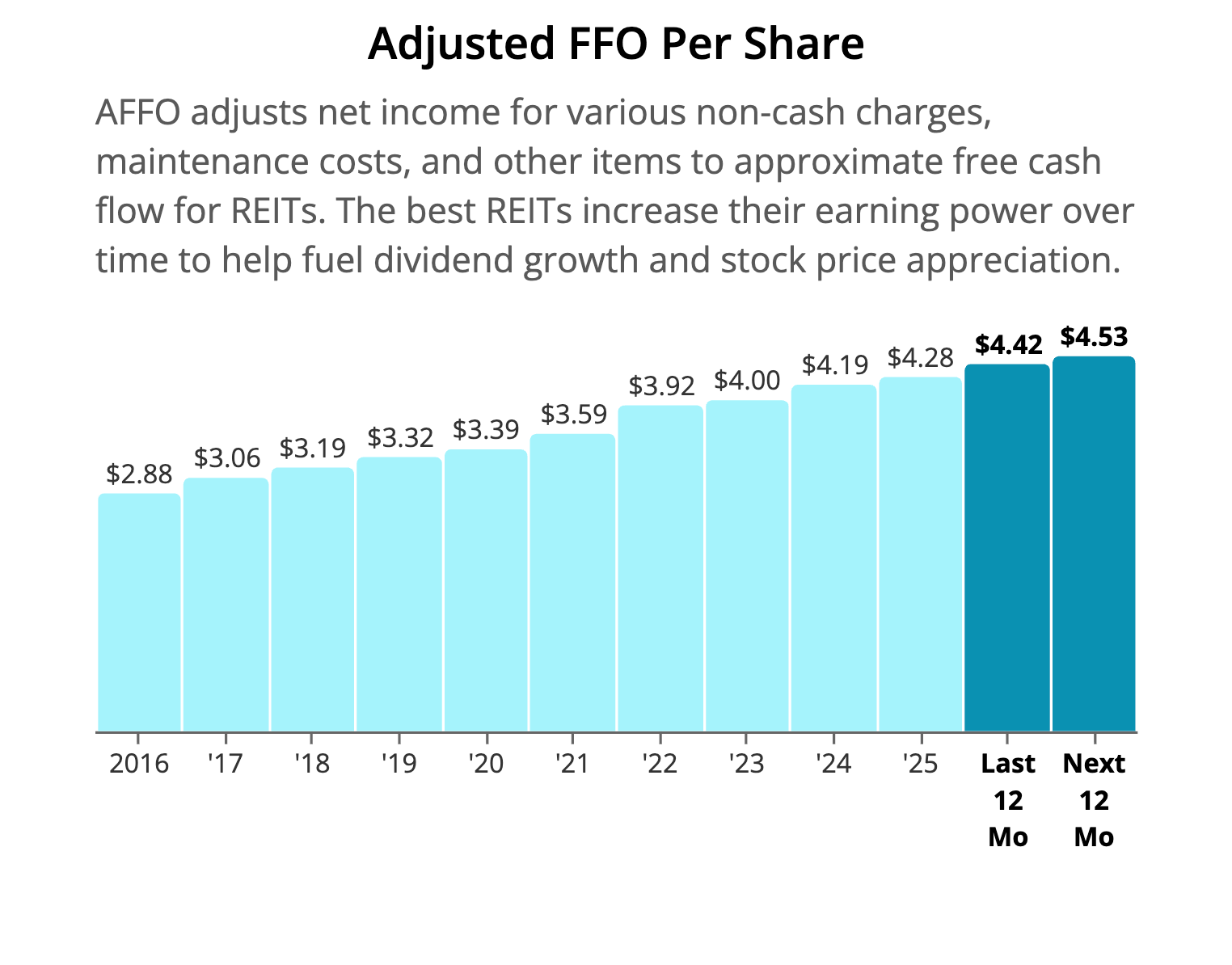
Realty Income's AFFO per share has risen from $2.88 in 2016 to $4.28 in 2025, a gain of about 49%, or roughly 4.5% a year. That steady climb is what has paid for its dividend increases.
There is no official formula, so each REIT sets its own. The usual adjustments are:
- Recurring capital spending. Roofs, parking lots, renovations and other spending needed to keep buildings rentable is subtracted.
- Leasing costs. Tenant improvements and broker commissions paid to sign new leases are subtracted.
- Straight-line rent. Accounting rules average a lease's rent increases over its whole term, so reported rent runs ahead of the cash collected in a lease's early years. AFFO uses the cash actually received.
- Non-cash charges. Stock-based pay and the amortization of debt costs are added back.
Some REITs use different names for the same idea, such as cash available for distribution (CAD) or funds available for distribution (FAD).
Because the recipe varies, compare a REIT's AFFO with its own history before comparing it with a peer's. A REIT that keeps redefining AFFO or excludes a growing list of costs deserves a closer look.
FFO vs. AFFO: Which Matters More?
For dividend investors, AFFO matters more. A dividend is paid from the cash left after a REIT maintains its properties, and FFO doesn't subtract that spending.
How far apart the two land depends on who pays for upkeep. Realty Income's tenants sign triple-net leases and pay for property taxes, insurance and maintenance themselves, so its AFFO of $4.28 per share was almost identical to its FFO of $4.25.
Landlords of offices, hotels and malls pay for much more themselves, from new lobbies to the build-outs that win tenants. Their AFFO can run well below FFO, so a payout ratio that looks comfortable on FFO can be stretched on AFFO.
AFFO Payout Ratio: The Dividend Safety Test
The AFFO payout ratio is the dividend per share divided by AFFO per share. It shows how much of a REIT's cash flow goes out as dividends and how much is left over.
Realty Income paid $3.22 per share in 2025 against AFFO of $4.28, a payout ratio of 75%. That ratio has dipped to about 73% over the last 12 months.
Every REIT's stock page on our site charts this ratio over the last decade. Realty Income's has drifted down from 83% in 2016 as AFFO grew faster than the dividend.
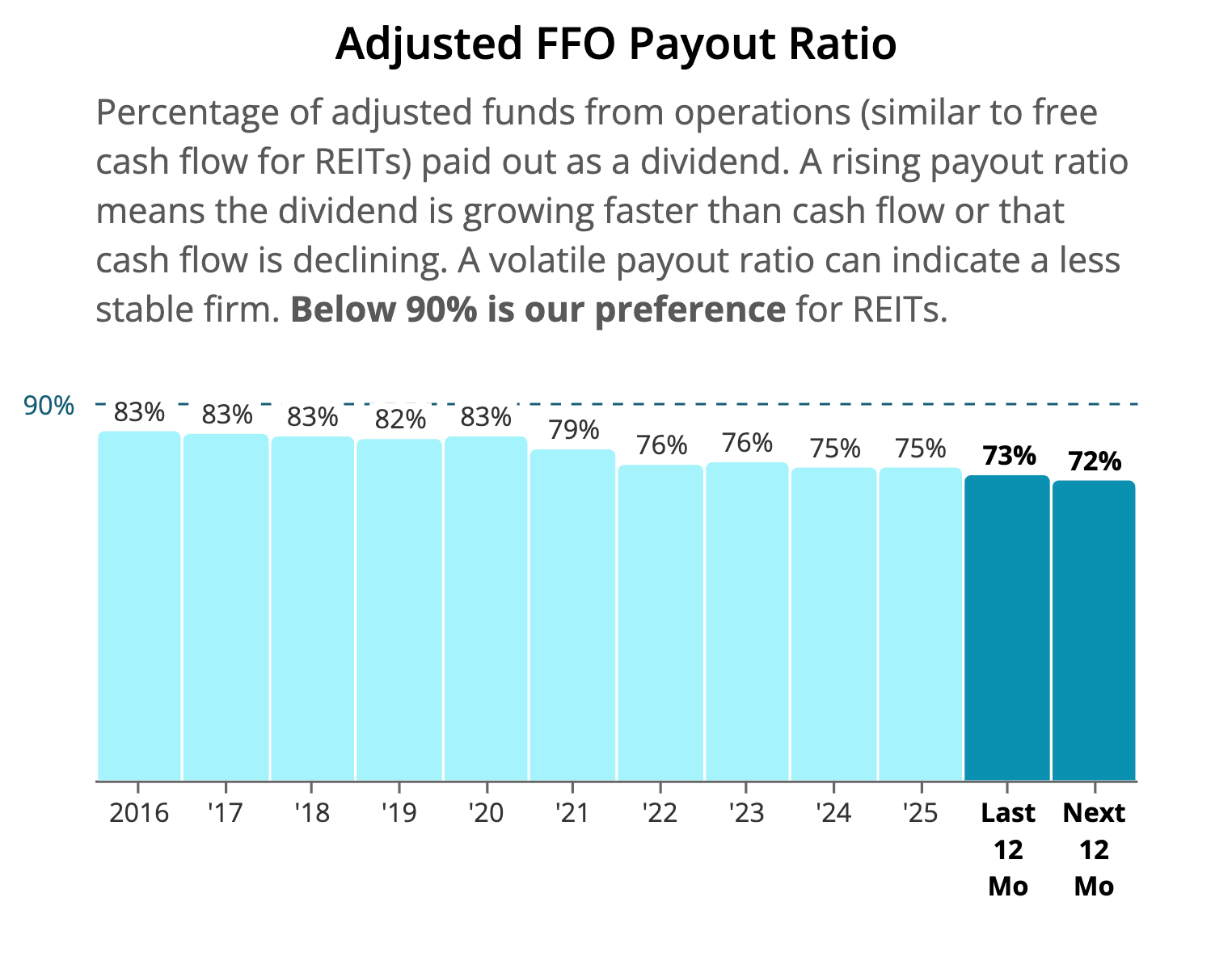
REITs must pay out at least 90% of their taxable income, so their payout ratios naturally run higher than those of other dividend stocks. We generally prefer an AFFO payout ratio below 90%. Of the 92 equity REITs we rate, six pay out more than 100% of AFFO, meaning the dividend is costing more than the business brings in.
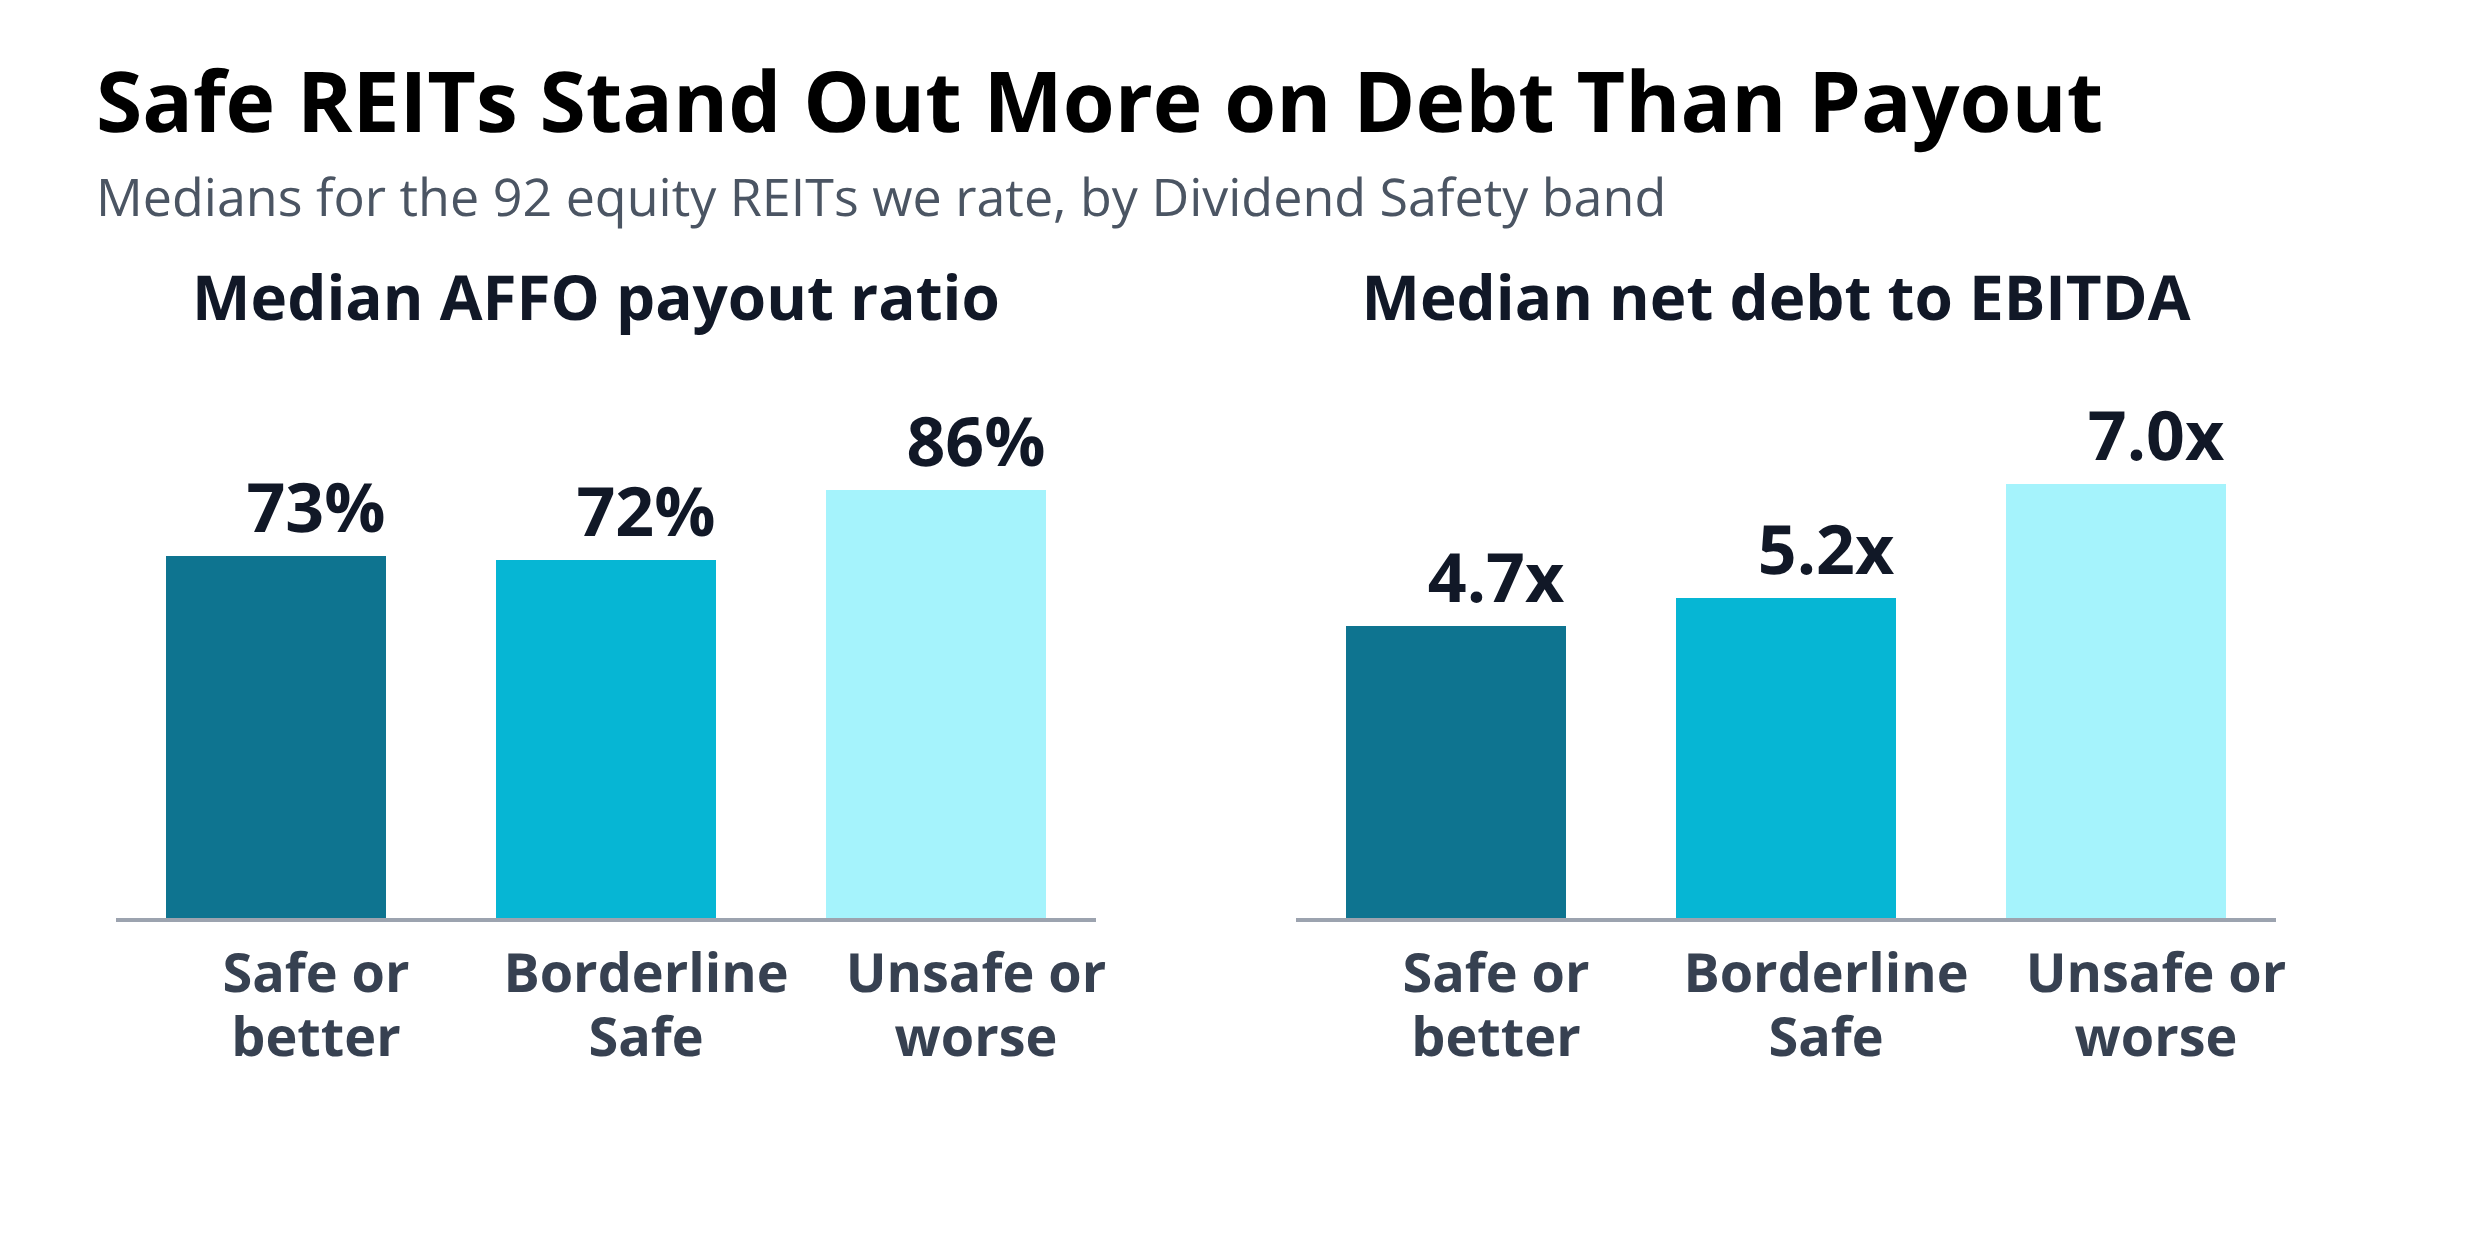
A low payout ratio alone doesn't make a dividend safe. The median REIT with a Safe or better Dividend Safety Score pays out 73% of AFFO, and the median Borderline Safe REIT pays out about the same, 72%. The bigger difference shows up in their debt.
Our guide to payout ratios explains the measure for other kinds of dividend stocks.
Net Debt to EBITDA: How Much Debt a REIT Carries
REITs pay out most of their cash, so they borrow to buy new properties. Net debt to EBITDA compares a REIT's debt, minus its cash, with a year of earnings before interest, taxes, depreciation and amortization. It roughly shows how many years of earnings it would take to repay what it owes.
Realty Income carries net debt of about 5.7 times EBITDA. That is a bit higher than the median REIT we rate Safe or better, but its A- credit rating keeps its borrowing costs low. Leverage jumped in 2021 after its merger with VEREIT and has since settled back near its long-run level.
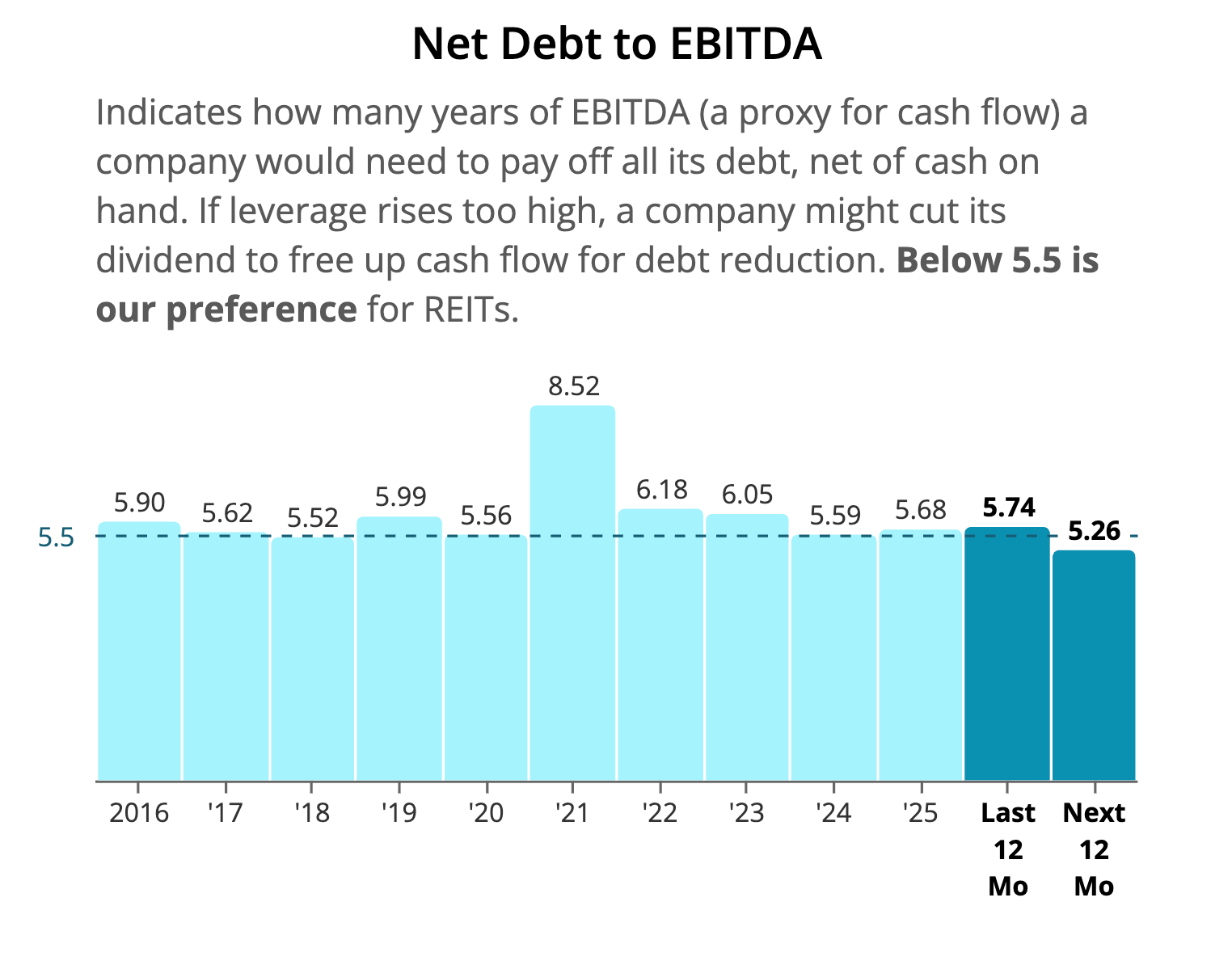
Across the REITs we rate, leverage lines up with dividend safety more clearly than payout does. The median REIT with a Safe or better Dividend Safety Score carries net debt of about 4.7 times EBITDA, against 5.2 times for Borderline Safe names and 7.0 times for those rated Unsafe or Very Unsafe.
Heavy debt hurts most when it comes due. A REIT that has to refinance cheap old loans at today's rates sees interest costs eat into AFFO, which is why the dividend checklist in our REIT guide also looks at credit ratings and floating-rate debt.
Cost of Capital and AFFO Yield
Because REITs keep little of their cash, they grow by raising new money and buying properties that earn more than that money costs. A REIT's cost of capital decides whether growth adds to AFFO per share or just makes the company bigger.
The simplest way to gauge the cost of new shares is the AFFO yield, which is AFFO per share divided by the share price. At $59.50, Realty Income's AFFO yield is about 7.6% based on the next 12 months.
Realty Income bought properties at an initial cash yield of 7.3% in 2025. Funding those deals with new shares alone would barely add to AFFO per share. So it blends in cheaper money. In January 2026 it sold $862.5 million of 3.5% convertible notes and announced a strategic relationship with the Singapore investor GIC.
This is why a falling share price can slow a REIT down. When the stock drops, each new share raises less money, and deals that made sense at a higher price stop adding to AFFO per share. Our October 2026 video, Finally Time to Buy REITs? Or a Falling Knife?, covers how this fall's jump in bond yields hit REIT prices. Our guide to how higher interest rates impact REITs explains the longer-term effects.
How to Value a REIT: P/AFFO and Dividend Yield
Price to AFFO is the REIT version of the price-to-earnings ratio. Divide the share price by AFFO per share, using next year's estimate for a forward ratio.
There is no single good P/AFFO. Fast-growing REITs with long runways, such as data center and cell tower owners, trade at higher multiples than slow-growing ones. The more useful test is how a REIT's multiple compares with its own history.
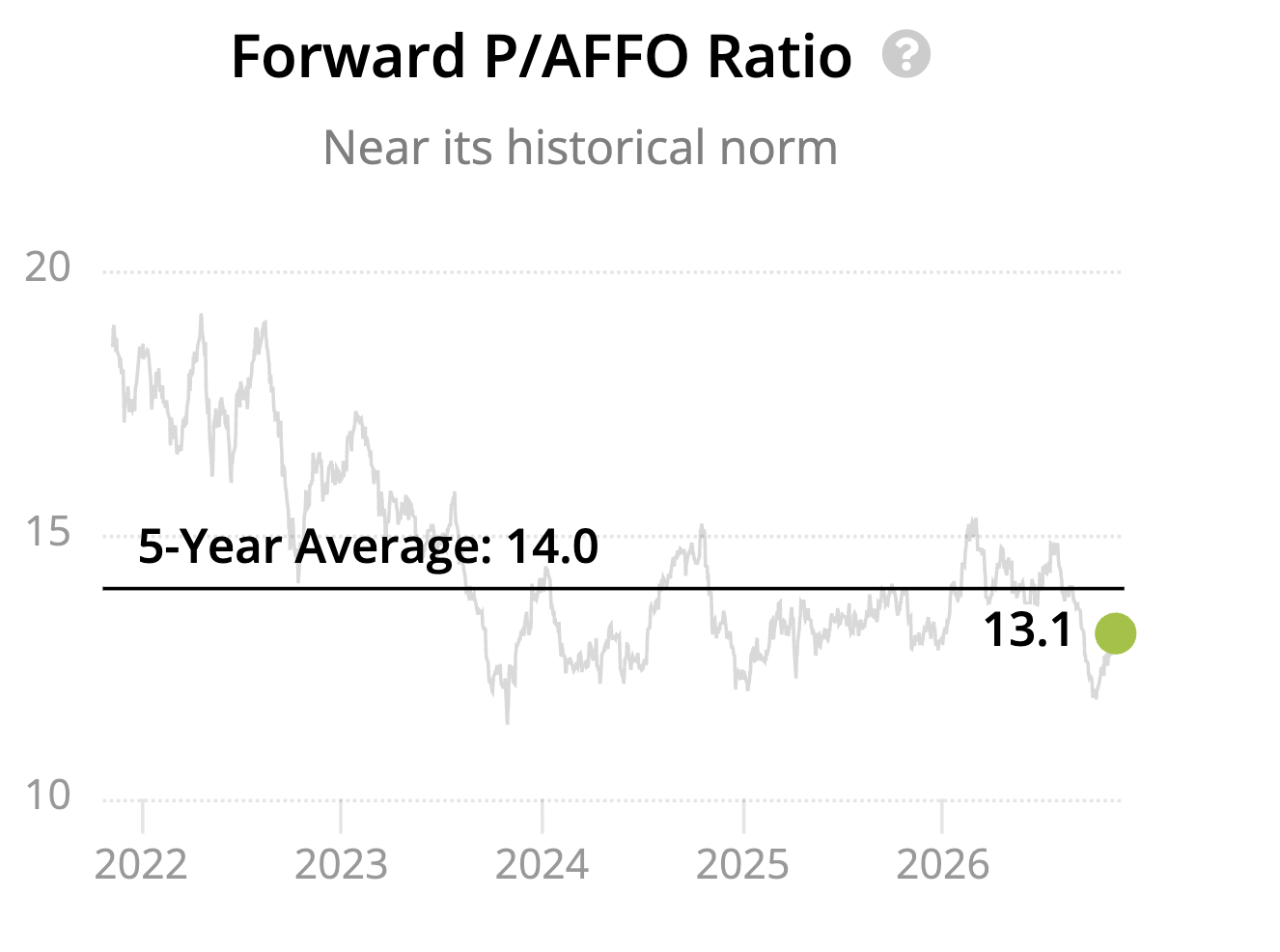
Realty Income trades at 13.1 times forward AFFO, a little below its five-year average of 14.0 and below the 15.6 average for the real estate sector.
Dividend yield tells the same story from the other side. Realty Income yields 5.48%, slightly above its five-year average of 5.26%.
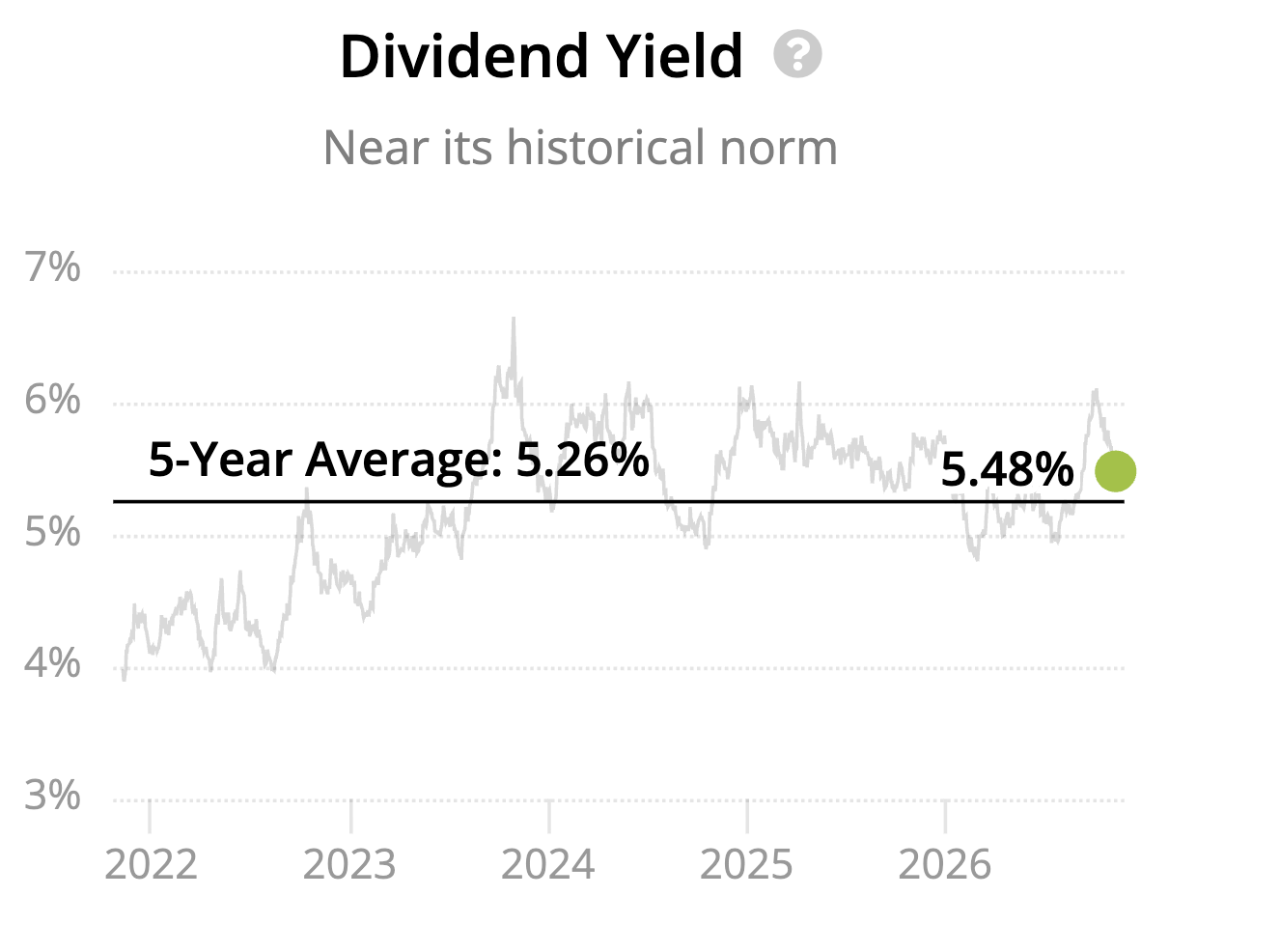
A yield above its long-term norm on a dividend we rate Safe can signal value. On an Unsafe dividend it is more often a warning. Our guide to dividend yield theory explains how to use that comparison.
Finally, add the yield to expected AFFO growth for a rough estimate of long-term total return. Realty Income's 2026 guidance of $4.38 to $4.42 per share implies AFFO growth of about 3%. Added to a 5.5% yield, that points to annual returns in the high single digits if the valuation holds steady.
Frequently Asked Questions
What is AFFO?
Adjusted funds from operations is a REIT's FFO minus recurring capital spending and leasing costs, adjusted for straight-line rent and non-cash charges. It estimates the cash available for dividends. Realty Income reported AFFO of $4.28 per share in 2025.
Adjusted funds from operations is a REIT's FFO minus recurring capital spending and leasing costs, adjusted for straight-line rent and non-cash charges. It estimates the cash available for dividends. Realty Income reported AFFO of $4.28 per share in 2025.
What is the difference between FFO and AFFO?
FFO adds depreciation back to net income and removes gains on property sales. AFFO also subtracts what a REIT spends to maintain and re-lease its properties. For a triple-net landlord like Realty Income the two are nearly equal ($4.25 and $4.28 per share in 2025), while office and hotel REITs can see a much wider gap.
FFO adds depreciation back to net income and removes gains on property sales. AFFO also subtracts what a REIT spends to maintain and re-lease its properties. For a triple-net landlord like Realty Income the two are nearly equal ($4.25 and $4.28 per share in 2025), while office and hotel REITs can see a much wider gap.
How do you calculate FFO?
Start with net income, add depreciation and amortization of real estate and impairments of depreciable real estate, then subtract gains from property sales. Divide by diluted shares for FFO per share.
Start with net income, add depreciation and amortization of real estate and impairments of depreciable real estate, then subtract gains from property sales. Divide by diluted shares for FFO per share.
What is a good AFFO payout ratio?
We generally prefer an AFFO payout ratio below 90% for most REITs. The median REIT with a Safe or better Dividend Safety Score pays out 73% of AFFO, while the median REIT rated Unsafe or Very Unsafe pays out 86%.
We generally prefer an AFFO payout ratio below 90% for most REITs. The median REIT with a Safe or better Dividend Safety Score pays out 73% of AFFO, while the median REIT rated Unsafe or Very Unsafe pays out 86%.
What is a good P/AFFO ratio?
It depends on the REIT's growth. Compare a REIT's P/AFFO with its own five-year average and with peers in the same property type. Realty Income trades at 13.1 times forward AFFO, against a five-year average of 14.0.
It depends on the REIT's growth. Compare a REIT's P/AFFO with its own five-year average and with peers in the same property type. Realty Income trades at 13.1 times forward AFFO, against a five-year average of 14.0.
Is FFO the same as cash flow?
No. FFO doesn't subtract capital spending and isn't a cash flow figure under accounting rules, and REITs say in their own filings that it shouldn't be used as a substitute for cash flow from operations. AFFO comes closer to the cash available for dividends.
No. FFO doesn't subtract capital spending and isn't a cash flow figure under accounting rules, and REITs say in their own filings that it shouldn't be used as a substitute for cash flow from operations. AFFO comes closer to the cash available for dividends.
Do mortgage REITs use FFO?
Rarely. Mortgage REITs own loans and mortgage-backed securities rather than buildings, so they have little depreciation to add back. Many report a version of distributable earnings instead. Our guide to mortgage REITs covers the measures that matter for them.
Rarely. Mortgage REITs own loans and mortgage-backed securities rather than buildings, so they have little depreciation to add back. Many report a version of distributable earnings instead. Our guide to mortgage REITs covers the measures that matter for them.
How are REIT dividends taxed?
REIT dividends follow different tax rules from most other stock dividends. Our short lesson on REIT taxation explains the details.
REIT dividends follow different tax rules from most other stock dividends. Our short lesson on REIT taxation explains the details.
The Bottom Line on REIT Metrics
Earnings per share tells you little about a REIT. Start with AFFO to see what it really earns, then check whether the AFFO payout ratio leaves a cushion and whether its debt is moderate. The REITs we rate Safe or better tend to pass both tests.
P/AFFO and yield against their own history then tell you whether the price makes sense.
To see how every REIT we cover stacks up on these measures, browse our list of REIT stocks ranked by Dividend Safety Score.