Continued Rate Hikes, Banking Stress Weigh on Dividend Outlook for Weaker Firms
The S&P 500 increased 1.6% in April, extending its year-to-date return to 9.1%. But if your dividend portfolio has mostly flatlined in 2023, you aren’t alone.
According to the Financial Times, about 80% of the S&P 500’s gain this year has been driven by just seven tech-oriented companies (which account for around 25% of the market): Apple, Microsoft, Nvidia, Meta, Alphabet, Amazon, and Tesla.
Most of these large-cap tech stocks are free cash flow machines with pristine balance sheets and products and services that consumers and businesses cannot live without. They can serve as safe havens when investors worry about the economic outlook.
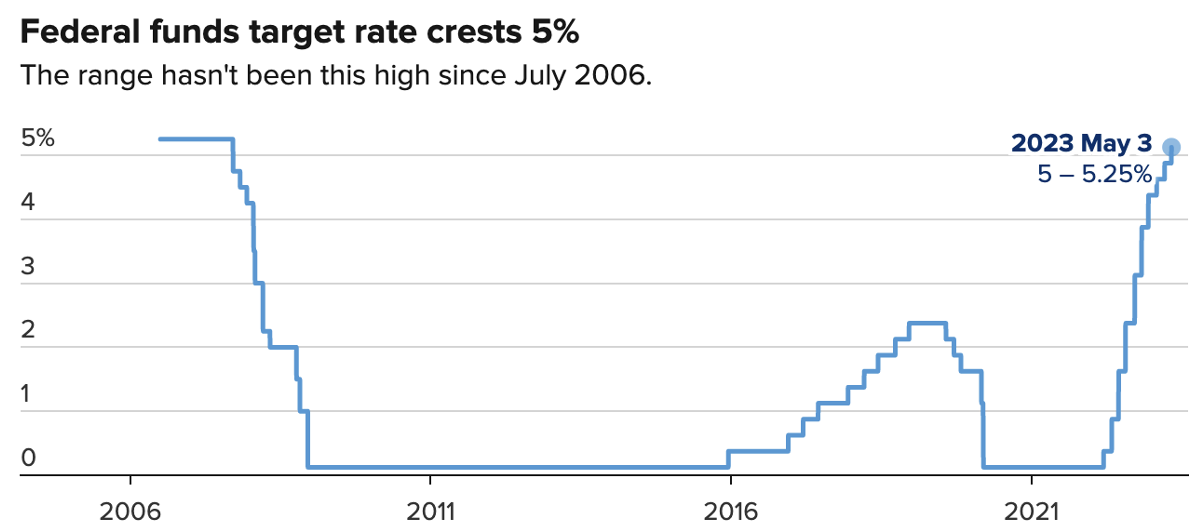
While it’s impossible to be certain about much in this economy, recession fears have kept building with the Fed raising interest rates to their highest level since just before the 2007-09 financial crisis.
Source: CNBC
Pressure from these rate hikes, which have occurred at the swiftest pace since the early 1980s, continues building.
The banking sector has felt the brunt of the impact since early March, with turmoil continuing last week as First Republic joined Silicon Valley Bank and Signature on the list of biggest-ever U.S. bank failures.
Each of these firms had high exposure to uninsured deposits and tech-focused customers, which faced a growing need to pull money from their accounts as venture funding slowed.
This fueled anxiety about the solvency of these banks since they had large unrealized losses in their bond portfolios after interest rates shot higher, creating a self-fulfilling prophecy as nervous customers yanked their deposits.
A few other West Coast-focused banks have some similarities to these fallen firms (most notably PacWest and Western Alliance, which we flagged in our March report), but most regional banks have reported generally stable deposit levels and low or no exposure to the flightier fintech clientele that triggered solvency issues.
While banks are admittedly tough to analyze due to their opaque balance sheets (we don’t own any in our portfolios), I would be surprised if widespread failures occurred across the stocks we cover. The main exception would be if the across-the-board plunge in regional bank share prices unnerves more depositors, which remains to be seen.
Investors also remain on edge about upward pressure on deposit costs (the primary funding source for banks) and the potential for higher credit losses, especially in commercial real estate (a material component of most regional banks’ loan books).
The longer short-term interest rates stay elevated, the more intense the battle will be to retain deposit holders that could seek out higher-yielding accounts elsewhere. Paying them more interest is the best bet to keep some of them around.
As funding costs continue to rise faster than interest received from a bank’s loans and investments, which generally have much longer durations, margins shrink.
Banks with the biggest duration mismatches between their assets (loans and investments) and liabilities (mostly deposits and some variable-rate wholesale funding) will feel the greatest profit squeeze.
We will keep an eye on these issues and provide updates on impacted banks as needed. Outside of a small handful of bank stocks, which reported more margin pressure than their peers, we haven’t felt compelled to change many of our Dividend Safety Scores for banks.
For now, fear seems to be reigning over fundamentals. But I say that with eyes wide open recognizing the banking industry’s complexity, the dangers of leverage, and the lack of visibility into near-term deposit trends.
Regardless, tighter lending conditions seem like a natural outcome as banks strike a more careful stance with managing their capital.
Firms with negative free cash flow and weak balance sheets could face the most pain following over a decade of easy-money conditions. These businesses may become less willing to tolerate high leverage as financing costs rise.
We take a conservative, long-term view of dividend risk, so most of these companies earned poor Dividend Safety Scores even before the banking sector’s volatility.
However, we still invest hours of analyst work every day reviewing the latest earnings reports, financial statements, industry developments, news, and other pieces of information across our coverage universe to keep our scores up to date.
Most of this monitoring work unfortunately remains invisible to you since we can’t publish notes on everything we research, and many times we reach conviction to “do nothing” (i.e., reaffirm a company’s Dividend Safety Score and move on).
We won’t get everything right, but I hope that you can feel some level of reassurance knowing that we never stop working behind the scenes to help you stay on top of dividend risk in your portfolio. Our efforts will hopefully continue being reflected in our real-time track record of catching dividend cuts, too.
As the economy slows further and interest rates remain elevated, dividend cuts seem likely to increase in frequency. Earlier this week, media giant Paramount (PARA) slashed its dividend by 79%, sending its share price tumbling by 28%. This marked Paramount’s first payout cut since 2009.
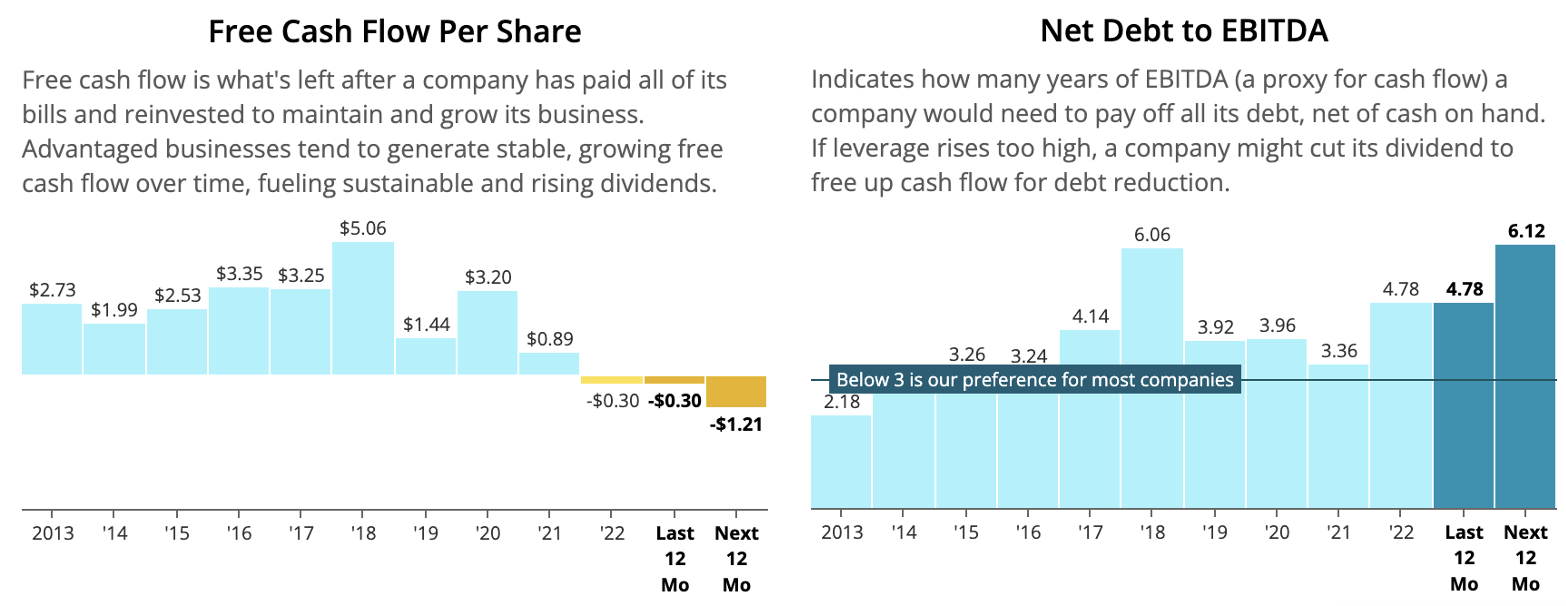
We had downgraded Paramount’s Dividend Safety Score from Borderline Safe to Unsafe in January due to concerns about the firm’s deteriorating free cash flow (necessary to support streaming service investments) and rising leverage, which triggered a one-notch credit rating downgrade to BBB- a couple of months later.
In addition to our Dividend Safety Scores and notes, our financial charts can help you spot potential concerns across your holdings.
Here are two relevant examples from Paramount’s page, showing concerning trends with free cash flow and the primary measure of leverage we evaluate:
Source: Simply Safe Dividends
We always encourage our members to explore financial charts for their holdings. This is a good way to gain more conviction in the companies you own and hold through the noise.