A Review of How Dividend Safety Scores Performed During the Pandemic
This review was first published in our January 2021 monthly newsletter sent to subscribers of our service and is written by our founder, Brian Bollinger.
2020 was the most unusual year I’ve seen as an investor. The S&P 500 fell 34% in 33 days during the first quarter, marking the fastest bear market in history as virus-induced shutdowns caused U.S. economic output to collapse at a record pace.
Policymakers then unleashed a dizzying amount of stimulus to prop up the economy as we learned more about COVID-19. The market has since roared back more than 60% from its March lows, including a 3.7% return in December to close out the year with an 18% gain.
Dividends appeal to many investors in retirement because they theoretically represent a stable source of cash flow regardless of the stock market’s ups and downs. 2020 put that assumption to the test and provided us with an opportunity to show the effectiveness of our Dividend Safety Score system during a recession.
Many income investors rely on our ratings to generate safe income and preserve capital in retirement. We take that responsibility very seriously and believe in being as transparent as possible with the performance of our scores. In this newsletter, we will review how our Dividend Safety Scores fared in 2020.
At the beginning of last year, we had Dividend Safety Scores on more than 1,300 stocks, covering the most popular companies. Approximately 25% of these businesses cut or suspended their dividends in 2020.
Including these events, we have now seen 706 dividend cuts since our scoring system’s inception in 2015. Investors who stuck with companies that scored above 60 (our Safe and Very Safe categories) would have avoided 98% (694 of 706) of the cuts in advance.
That said, the pandemic threw a number of curveballs at us as various industries were forced to temporarily shut down to help slow transmission of the virus.
Our scores use a blend of qualitative and quantitative analysis to take a conservative view of risk over a full economic cycle. But we had not considered such extreme downside scenarios (e.g. sales plunging towards zero) for “non-essential” industries such as restaurants and parts of retail.
As this new information became available in March and April, we worked around the clock to provide dividend safety updates across our coverage universe.
In some instances, we felt Dividend Safety Score downgrades were appropriate in light of the new normal companies would be operating in as the pandemic raged on.
The vast majority of our scores remained stable during this time, but it still wasn’t a good feeling to send out a downgrade note in March after so much risk was already being priced in, even if the downgrade technically came in advance of a cut announcement.
Dividend Safety Scores are most valuable when they predict dividend cuts far out in advance, before the market is worried and while investors still have time to adjust their portfolios.
This got me wondering how predictive our scores were last year if we only used the pre-pandemic ratings we had at the start of 2020 and weren’t allowed to make any score changes, even as new information rolled in and the economy locked down.
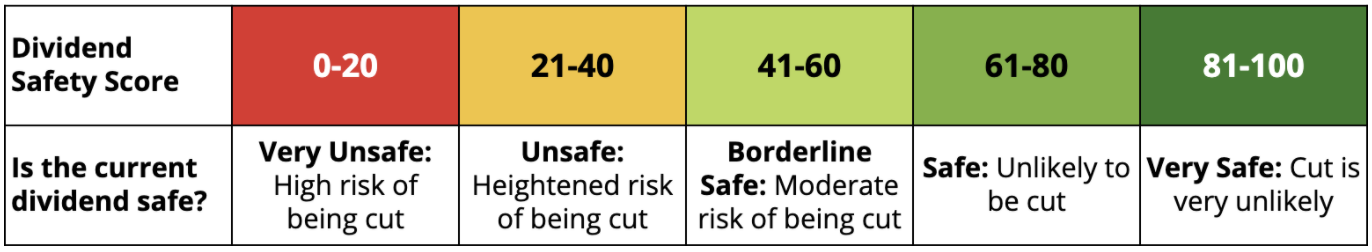
Before diving into the results of our study, it’s worth quickly reviewing our five Dividend Safety Score buckets:
At the start of 2020, we had Dividend Safety Scores on 1,313 dividend-paying stocks (excluding a few special situations, such as companies in the process of being acquired).
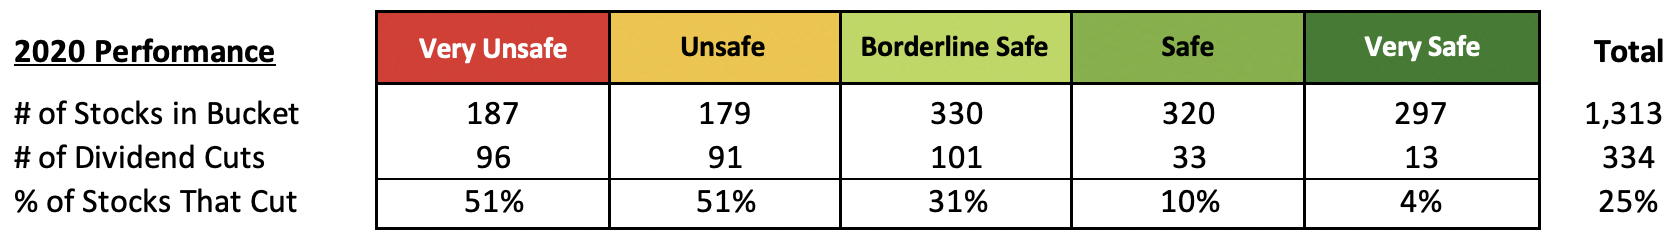
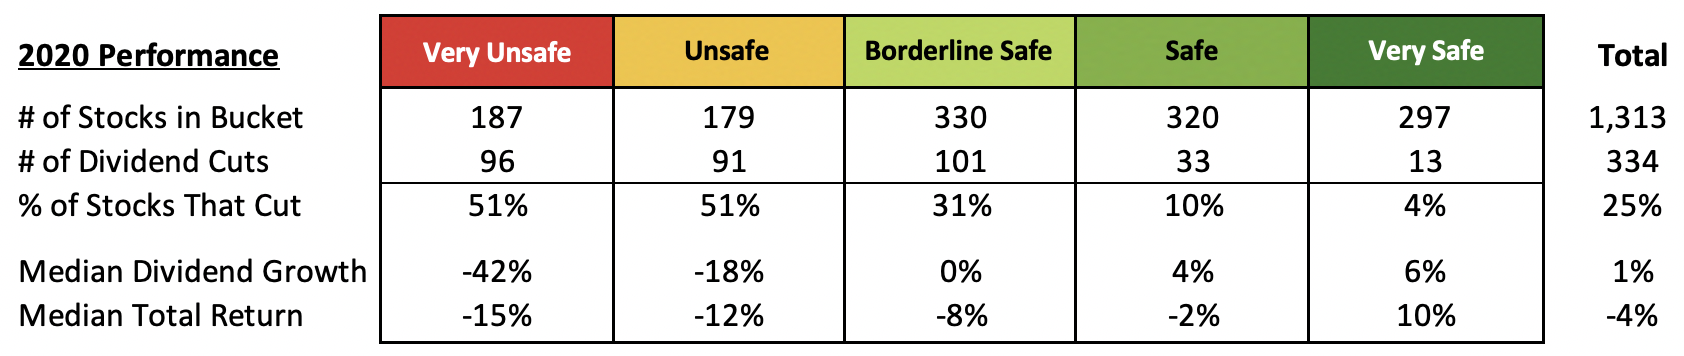
The first table below shows how many of these stocks were in each of our five risk buckets last January and how many stocks in each bucket went on to cut or suspend their dividends in 2020.
Again, please note that this data is grouped only byhow companies were scored as of January 2020 to show the longer-term predictive value of our scoring system.
Even if a stock started 2020 with a Safe rating and was later downgraded to Unsafe in response to the pandemic, it would remain in the Safe category below for the purposes of this study.
Across our coverage universe, 25% of stocks (334 out of 1,313) cut or suspended their dividends in 2020.
While 51% of stocks with Very Unsafe and Unsafe ratings at the start of the year went on to cut their dividends, only 10% and 4% of Safe and Very Safe-rated companies cut, respectively. Put another way, across our Safe and Very Safe buckets, 93% of those stocks (572 out of 617) maintained or raised their dividends last year.
Our ratings last January did not have the benefit of knowing a pandemic was around the corner and would cause the sharpest economic contraction in history. But even without this information, our pre-pandemic Safe and Very Safe scores did well in identifying companies with safe payouts.
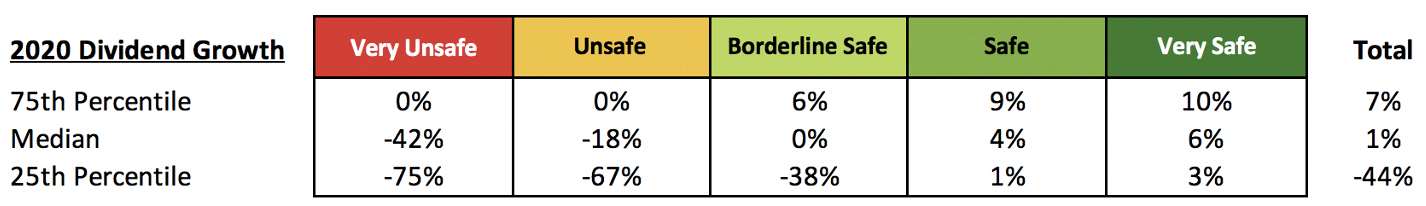
We also observed that dividend growth slowed significantly when moving from our safest to riskiest buckets.
Very Unsafe-rated stocks delivered median dividend growth of -42% last year versus -18% across all Unsafe stocks, 0% for our Borderline Safe bucket, and 4% for Safe stocks.
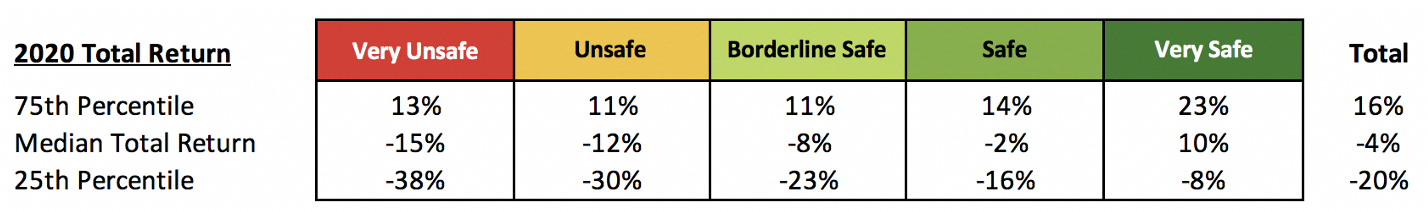
The bottom quartile of performers (“25th Percentile”) in our Very Unsafe and Unsafe buckets saw their dividends decline by at least 75% and 67%, respectively, which was significantly worse than the change in dividends across the weakest performers in our higher-rated categories. We also reviewed the total return performance of each bucket given the importance of capital preservation in retirement. Smaller losses reduce risk and make it easier to stay the course.
Across all 1,313 stocks that had ratings last January, the median total return in 2020 was -4%.
Stocks that had Very Unsafe and Unsafe ratings performed the weakest with median total returns of -15% and -12%, respectively. The bottom quartile performers in these two speculative buckets lost at least 30%, too.
Investors in these companies were not only more likely to experience large dividend cuts, but they also faced higher risk of substantial capital losses.
Stocks with Safe and Very Safe scores entering the recession performed much better, with median total returns of -2% and 10%, respectively. The Very Safe category delivered especially impressive results with its top quartile of stocks gaining at least 23%. Here’s a final recap of each Dividend Safety Score bucket’s 2020 performance across all the metrics we reviewed, based only on how stocks were rated in January last year: Overall, our Safe and Very Safe-rated stocks held up relatively well even after the pandemic struck and created an unusual recession. This data reinforces our message that conservative income investors should focus on owning companies with Safe and Very Safe scores.
We will never have complete information when making investment decisions. 2020 proved that. But by taking a conservative, long-term approach to assessing dividend risk, we will continue doing everything we can to deliver predictive Dividend Safety Scores you can use to keep your retirement portfolio between the guardrails.
Despite a challenging 2020, a conservative dividend investing strategy could be particularly appealing going forward in today’s frothy market environment.
The S&P 500’s 18% return in 2020 didn’t tell the whole story as performance differed dramatically between various types of stocks. So-called “growth” stocks gained 37% while “value” stocks were flat, as measured by the Russell 3000 growth and value indexes.
Dividend stocks often fall into the “value” bucket. Many of these businesses generate solid cash flow but are in a more mature phase of their corporate lifecycles. Rather than reinvest every penny for faster growth, they typically pay out more of their cash flow as dividends.
Most dividend strategies were not in vogue during 2020 as plunging interest rates caused investors to place more value on future growth over immediate cash flow. Vanguard’s REIT Index (VNQ) lost 5%, the utilities sector (XLU) was flat, the S&P 500 Dividend Aristocrats ETF (NOBL) only gained 8%, and the S&P 500 High Dividend Low Volatility ETF (SPHD) fell 10%.
As we previously mentioned, the median 2020 total return across the more than 1,300 stocks we had Dividend Safety Scores on was a loss of 4%. Given this backdrop, our Top 20 Dividend Stocks, Conservative Retirees, and Long-term Dividend Growth portfolios all trailed the S&P 500 with returns of 3.1%, -1.7%, and 14.4%, respectively.
I believe a time will come when the market places more value on these relatively slow but steady businesses. For now, high-flying growth stocks and cyclical companies are being bid up as investors price in expectations for years of zero interest rates, additional stimulus measures from a Democrat-controlled government, and continued economic recovery as vaccines are distributed.
The S&P 500’s forward P/E ratio now sits above 22, its highest level since the tech bubble began to pop 20 years ago. While it can feel tempting to chase whatever asset class has been the hottest, I believe we live in times where it will pay off, perhaps sooner rather than later, to heed Warren Buffett’s advice to be fearful when others are greedy.
Our portfolios remain conservatively positioned with ownership stakes in businesses that, in aggregate, continue generating solid cash flow, maintain strong balance sheets, pay safe dividends, and trade at a discount to the broader market.
I look forward to navigating 2021 together and thank you for your support of Simply Safe Dividends.