Dividend Safety Scores™
Led by our founder, a CPA and former equity analyst, our scores analyze payout ratios, balance sheets, company news, and more to predict a company's dividend risk. Ratings are available to subscribers.
-
0 - 20Very Unsafe
- High risk of being cut
-
21 - 40Unsafe
- Heightened risk of being cut
-
41 - 60Borderline
- Moderate risk of being cut
-
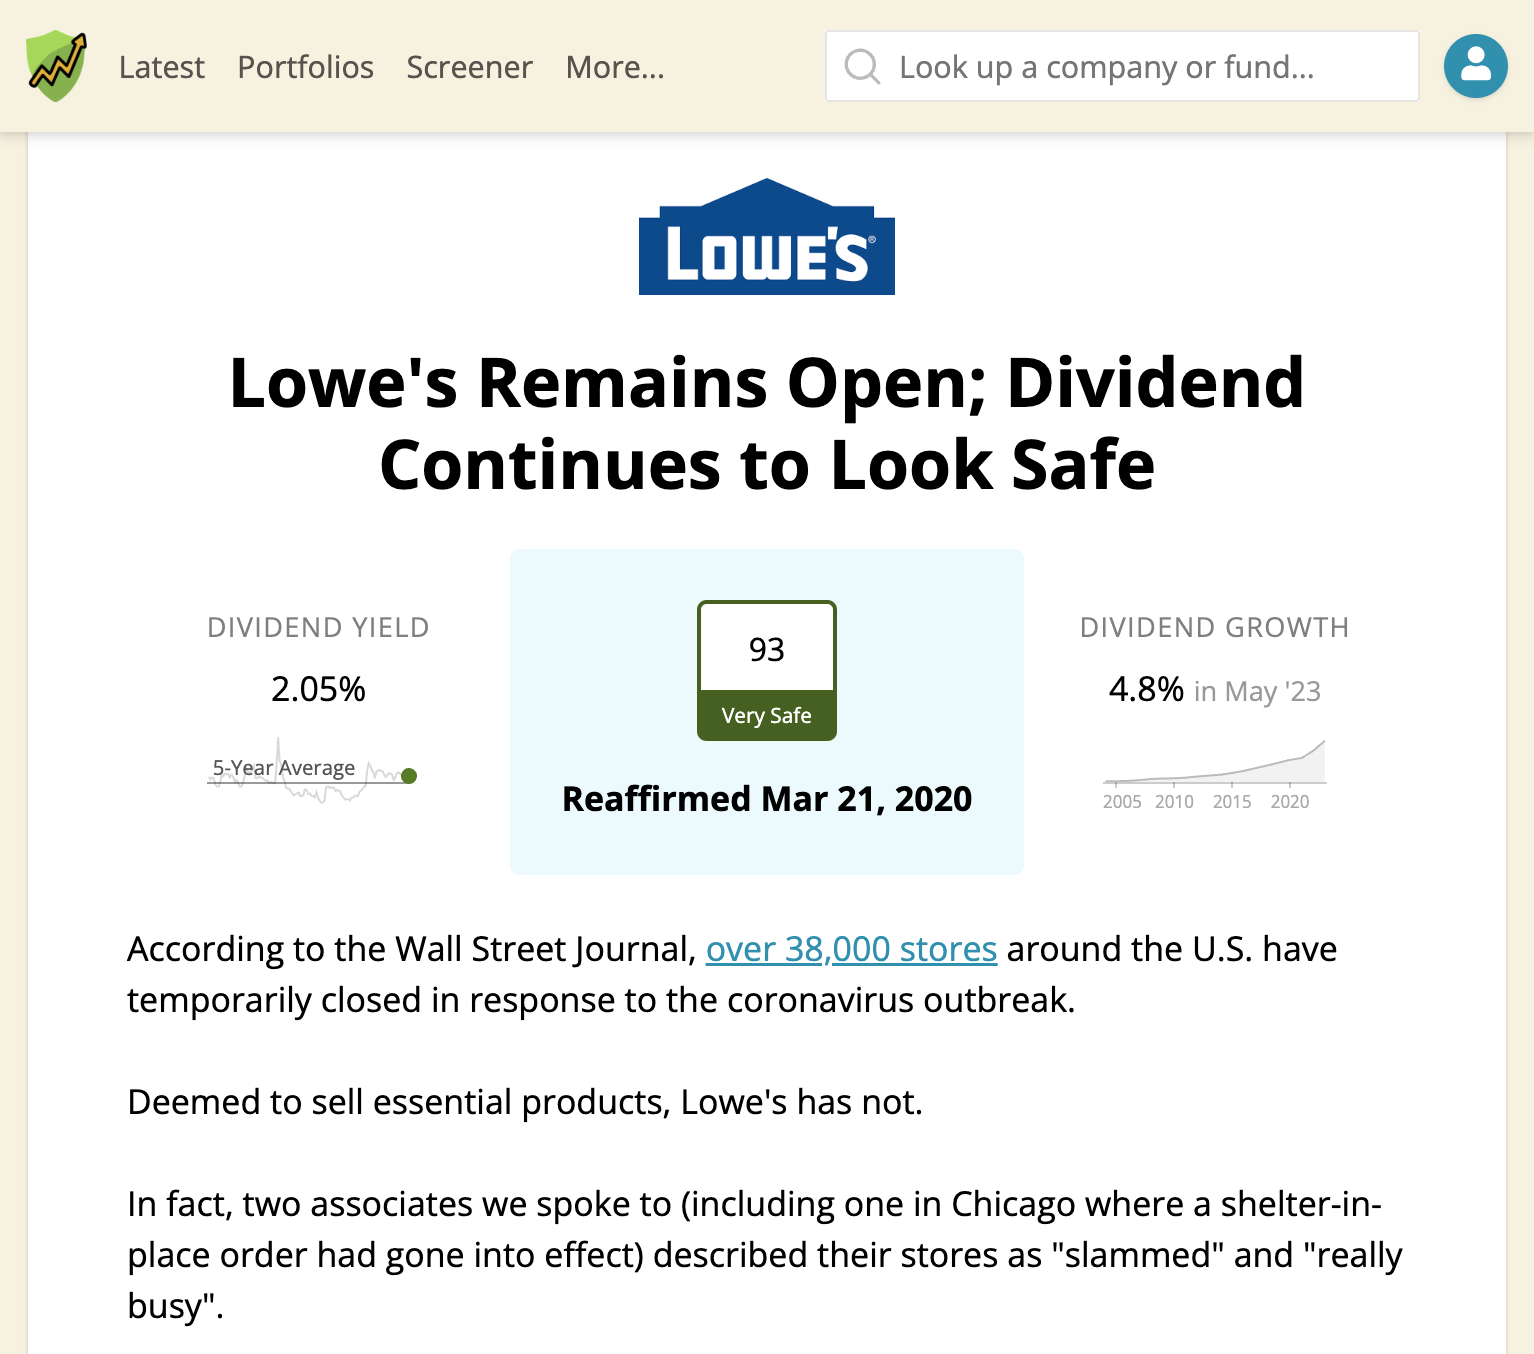
61 - 80Safe
- Unlikely to be cut
-
81 - 100Very Safe
- Very unlikely to be cut
Our real-time track record
97% of dividend cuts caught in advance
As straight shooters, we maintain a public track record of how our ratings have performed. Since our scoring system's inception in 2015, investors who stuck with companies that scored above 60 (our Safe threshold) would have avoided 97% (914 of 935) of dividend cuts that've occurred.
The scores below reflect our rating before the cut was announced, demonstrating the predictive value of Dividend Safety Scores™.
-
20Very Unsafe
-
Flowers Foods (FLO) cut its dividend by 50%. The packaged bakery company needed to free up cash for debt reduction following its acquisition of Simple Mills a year earlier. With earnings under pressure from weak bread demand, a challenging consumer environment, and higher interest expense, the payout ratio had become unsustainable, ending a 23-year streak of consecutive dividend increases.
-
20Very Unsafe
-
Crescent Capital BDC (CCAP) lowered its dividend by 19%. Falling interest rates compressed income on the BDC's floating-rate loan portfolio, and a cluster of nonperforming healthcare loans added further pressure on earnings, pushing the payout ratio above 100%.
-
20Very Unsafe
-
B&G Foods (BGS) slashed its dividend by 50%. The packaged food company has struggled to reduce its debt load for years, with leverage still running very high despite an earlier dividend cut in 2022 and ongoing asset sales. Weak consumer demand for its shelf-stable brands and rising input costs pushed the payout ratio above 100%, forcing another cut to free up cash for debt reduction. Shares fell over 10% on the news.
Industry expertise
Overseen by a CPA and former equity analyst
Dividend Safety Scores™ are not some black-box quant metric. Human input is the bedrock for assigning and monitoring our ratings.
Our founder, Brian Bollinger, is a CPA and former equity analyst at a multibillion-dollar investment firm. Brian has spent thousands of hours researching companies and digging into the weeds of financial statements.
In 2015, Brian developed Dividend Safety Scores™ by going through our coverage universe brick-by-brick, studying each industry and business to cement the metrics that matter most. Most of Brian's time is spent monitoring our coverage for material changes in dividend risk.
Rigorous analysis
Every stone is turned over
Dividend Safety Scores™ predict dividend risk over a full economic cycle by analyzing the most important metrics for dividends, including:
- Payout ratios
- Debt levels and coverage metrics
- Recession performance
- Dividend longevity
- Industry cyclicality
- Free cash flow generation
- Forward-looking analyst estimates
Our analysts take all of this information into account as well as the latest company news, industry developments, and key business model drivers to assign Dividend Safety Scores™ between 0 and 100.
All of the financial data we rely on is delivered to us daily by Standard & Poor's (S&P), one of the world's leading financial data vendors.
Up-to-date ratings
Quarterly reviews, continuous monitoring
We're notified internally if a company's fundamentals experience a change that could alter its dividend risk profile. We'll then dive in to investigate. We'll review the latest earnings report, skim call transcripts, and scrutinize the firm's business model to determine whether a score change is prudent.
At a minimum, all ratings are reviewed after quarterly earnings. If material news (e.g. a lawsuit) comes out between earnings, we'll initiate a review. Published review dates make it crystal clear how up-to-date a score is.
Time-tested results
Validated during the pandemic
The pandemic threw a curveball as swaths of the economy shut down and the sharpest economic contraction in U.S. history ensued. An astonishing 25% (334 out of 1,313) of companies we rated cut their dividends in 2020.
Once the pandemic hit, we worked quickly to incorporate new information into our ratings. When the dust settled, our Safe and Very Safe buckets had avoided all but 8 (or 97.6%) of the cuts in 2020.
Moreover, our scores demonstrated their long-term predictive value.
Using our pre-pandemic ratings as of January 2020 and ignoring any score changes we made as new information rolled in, 93% of the 334 dividend cuts would have still come from firms that scored below our Safe threshold.
Here's a breakdown of the 334 cuts by score bucket as of January 2020:
Pre-pandemic ratings
Here's a breakdown of the 334 cuts by score bucket as of January 2020:
| 2020 Performance | Very Unsafe |
Unsafe |
Borderline |
Safe |
Very Safe |
Total |
|---|---|---|---|---|---|---|
| # of Stocks in Bucket | 187 | 179 | 330 | 320 | 297 | 1,313 |
| # of Dividend Cuts | 96 | 91 | 101 | 33 | 13 | 334 |
| % of Stocks That Cut | 51% | 51% | 31% | 10% | 4% | 25% |
For a more thorough analysis, read our full pandemic review.
Time-saving clarity
Interwoven throughout the site
At a glance, you'll be able to identify holdings with heightened dividend risk. Got a new investment idea? Vet the company in seconds by looking up its rating. Need more ideas? Screen our coverage of 1,000 rated companies.

Email notifications
Alerts keep you in the know
If we issue a change to a score in your portfolio, you'll receive an email notification along with our rationale for the change. No surprises or quantitative mumbo-jumbo. Just clear, concise research crafted by real analysts so you'll never feel in the dark.
Thorough explanations
Paired with in-depth research
More than just a number, ratings are often published alongside rigorous research reports. That way, you can make informed decisions. Many customers find as much value in our research as in our ratings.
Tailored insights
Industry nuances baked in
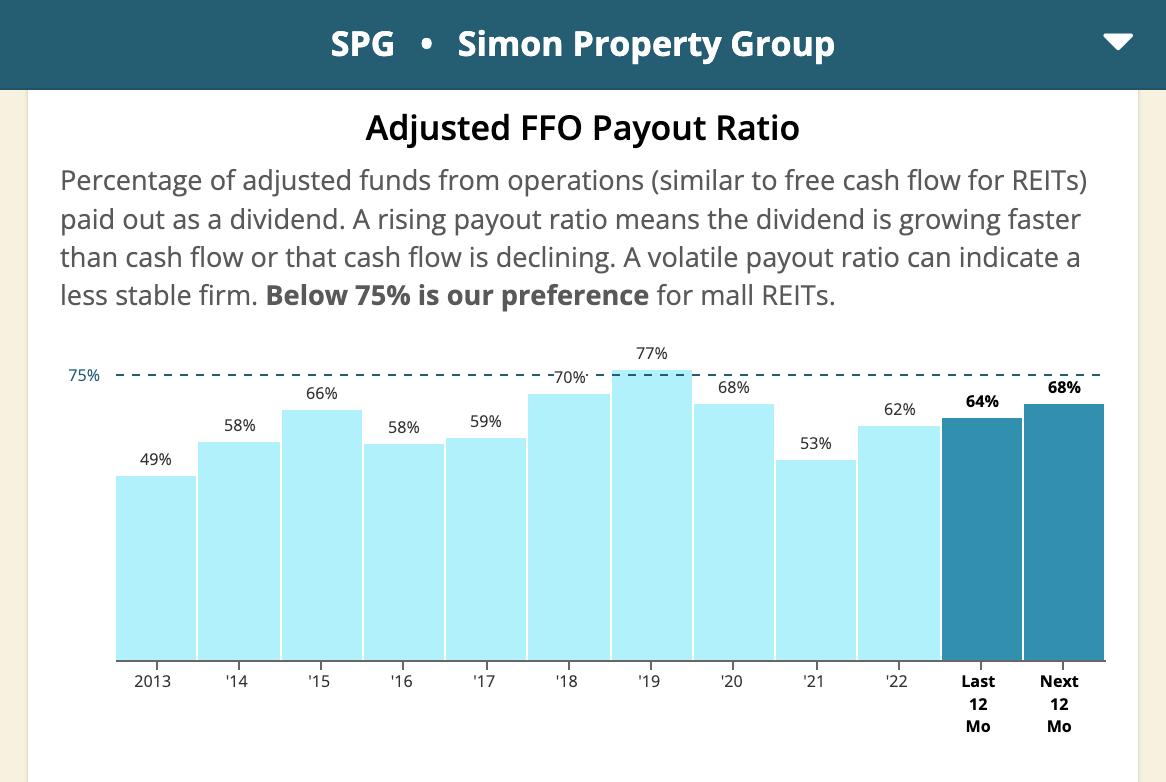
Our ratings recognize meaningful differences between industries. For example, a utility company enjoys more stable earnings than a steelmaker, so a utility can afford to maintain a higher payout ratio. We also utilize industry-specific metrics, such as AFFO for REITs and DCF for MLPs.
Ready to analyze your income's safety?
Check out our Dividend Safety Scores™, tracking tools, research, and more with a 14-day free trial. All you need is an email.