Yield on Cost: Formula, Examples and How to Use It
Yield on cost is a stock's annual dividend divided by the price you paid for it. If you bought shares at $40 and they now pay $2 a year, your yield on cost is 5%, no matter where the share price trades today.
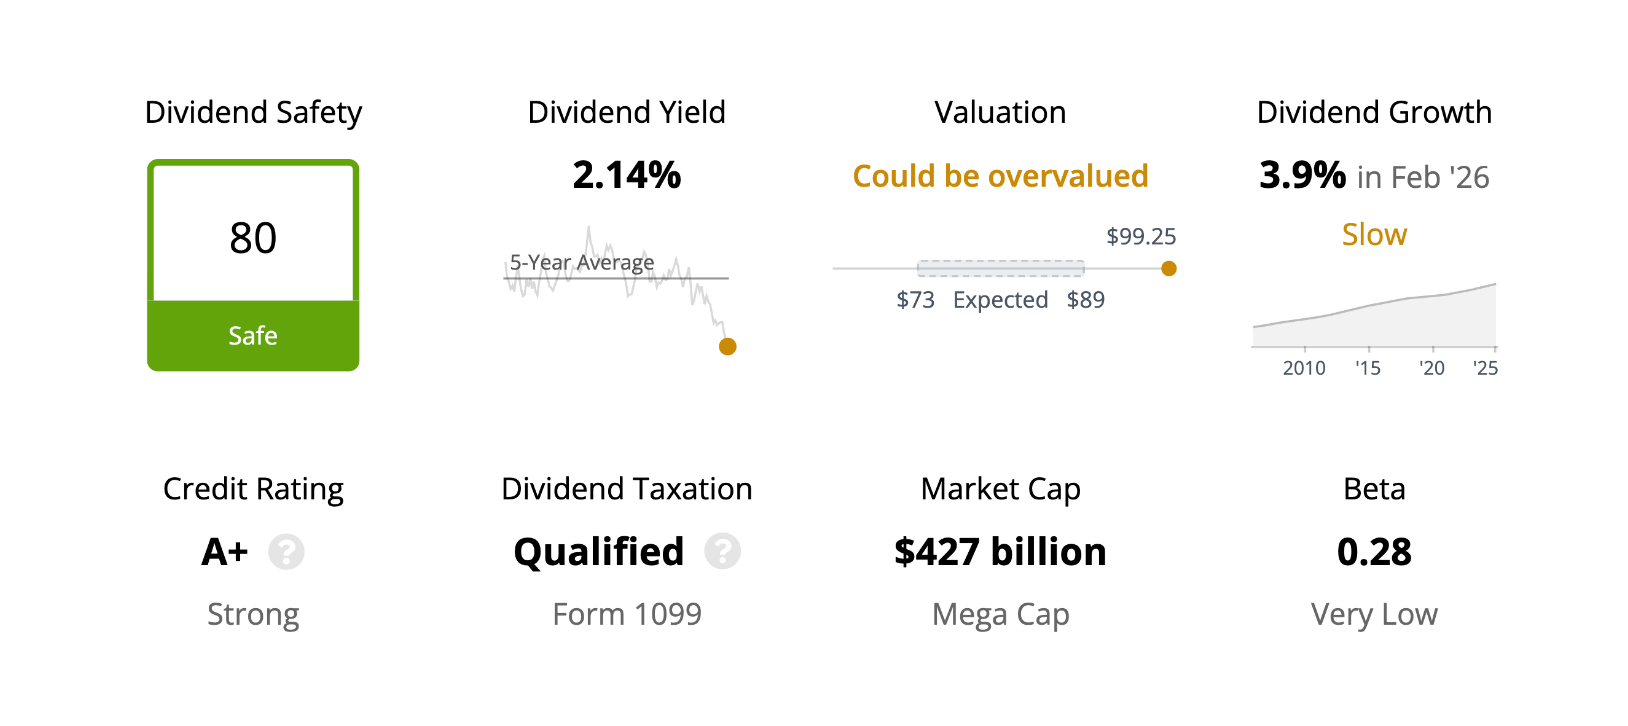
It rises when a company raises its dividend. Coca-Cola (KO) shares bought at the end of November 2016 cost $40.35. Coca-Cola now pays $2.12 a year, so those shares yield 5.25% on cost, while a buyer at today's $99.25 price gets 2.14%.
That makes yield on cost a useful scorecard for a dividend growth strategy. It is a poor tool for deciding what to buy, hold or sell, and we explain why below.
How to Calculate Yield on Cost
The yield on cost formula is simple:
Yield on cost = annual dividend per share ÷ cost basis per share
Start with the stock's current annual dividend per share. Coca-Cola raised its quarterly dividend to 53 cents in February 2026, its 64th straight annual increase, so its annual dividend is $2.12.
Then find your cost basis per share, which is what you paid for each share. Buy 100 shares for $4,035 and your cost basis is $40.35 a share.
Divide the first number by the second. $2.12 ÷ $40.35 gives a yield on cost of 5.25%.
Each dividend raise lifts it. Before the February raise, Coca-Cola paid $2.04 a year, which worked out to 5.06% on the same shares. A dividend cut lowers it just as directly.
If you bought shares at different prices, or reinvested dividends along the way, use the totals instead. Divide your total annual dividend income from the stock by the total amount you have invested in it. Add 50 Coca-Cola shares bought at $70 to the 100 above, and your $318 of annual dividends on $7,535 invested is a yield on cost of 4.22%. Your broker's cost basis figures make this easy.
Yield on Cost vs. Dividend Yield
Both measures use the same dividend. The difference is the price underneath it.
Dividend yield divides the annual dividend by today's share price. It tells you what a new dollar invested today would earn, and it moves every time the stock does. Coca-Cola's stock page shows a dividend yield of 2.14% at the November 13 close.
Yield on cost divides the same $2.12 by what you paid. It ignores the share price after your purchase and changes only when the dividend changes or when you buy or sell shares.
So the 2016 buyer and today's buyer collect the same $2.12 per share. One earns 5.25% on the money invested, the other 2.14%.
What Is a Good Yield on Cost?
There is no single good number. A good yield on cost is one that keeps rising, because that means the dividend keeps growing.
How high it gets depends far more on dividend growth than on the starting yield. We looked at eight well-known dividend growers that we rate Safe or Very Safe today, bought at their November 2016 month-end closing prices.
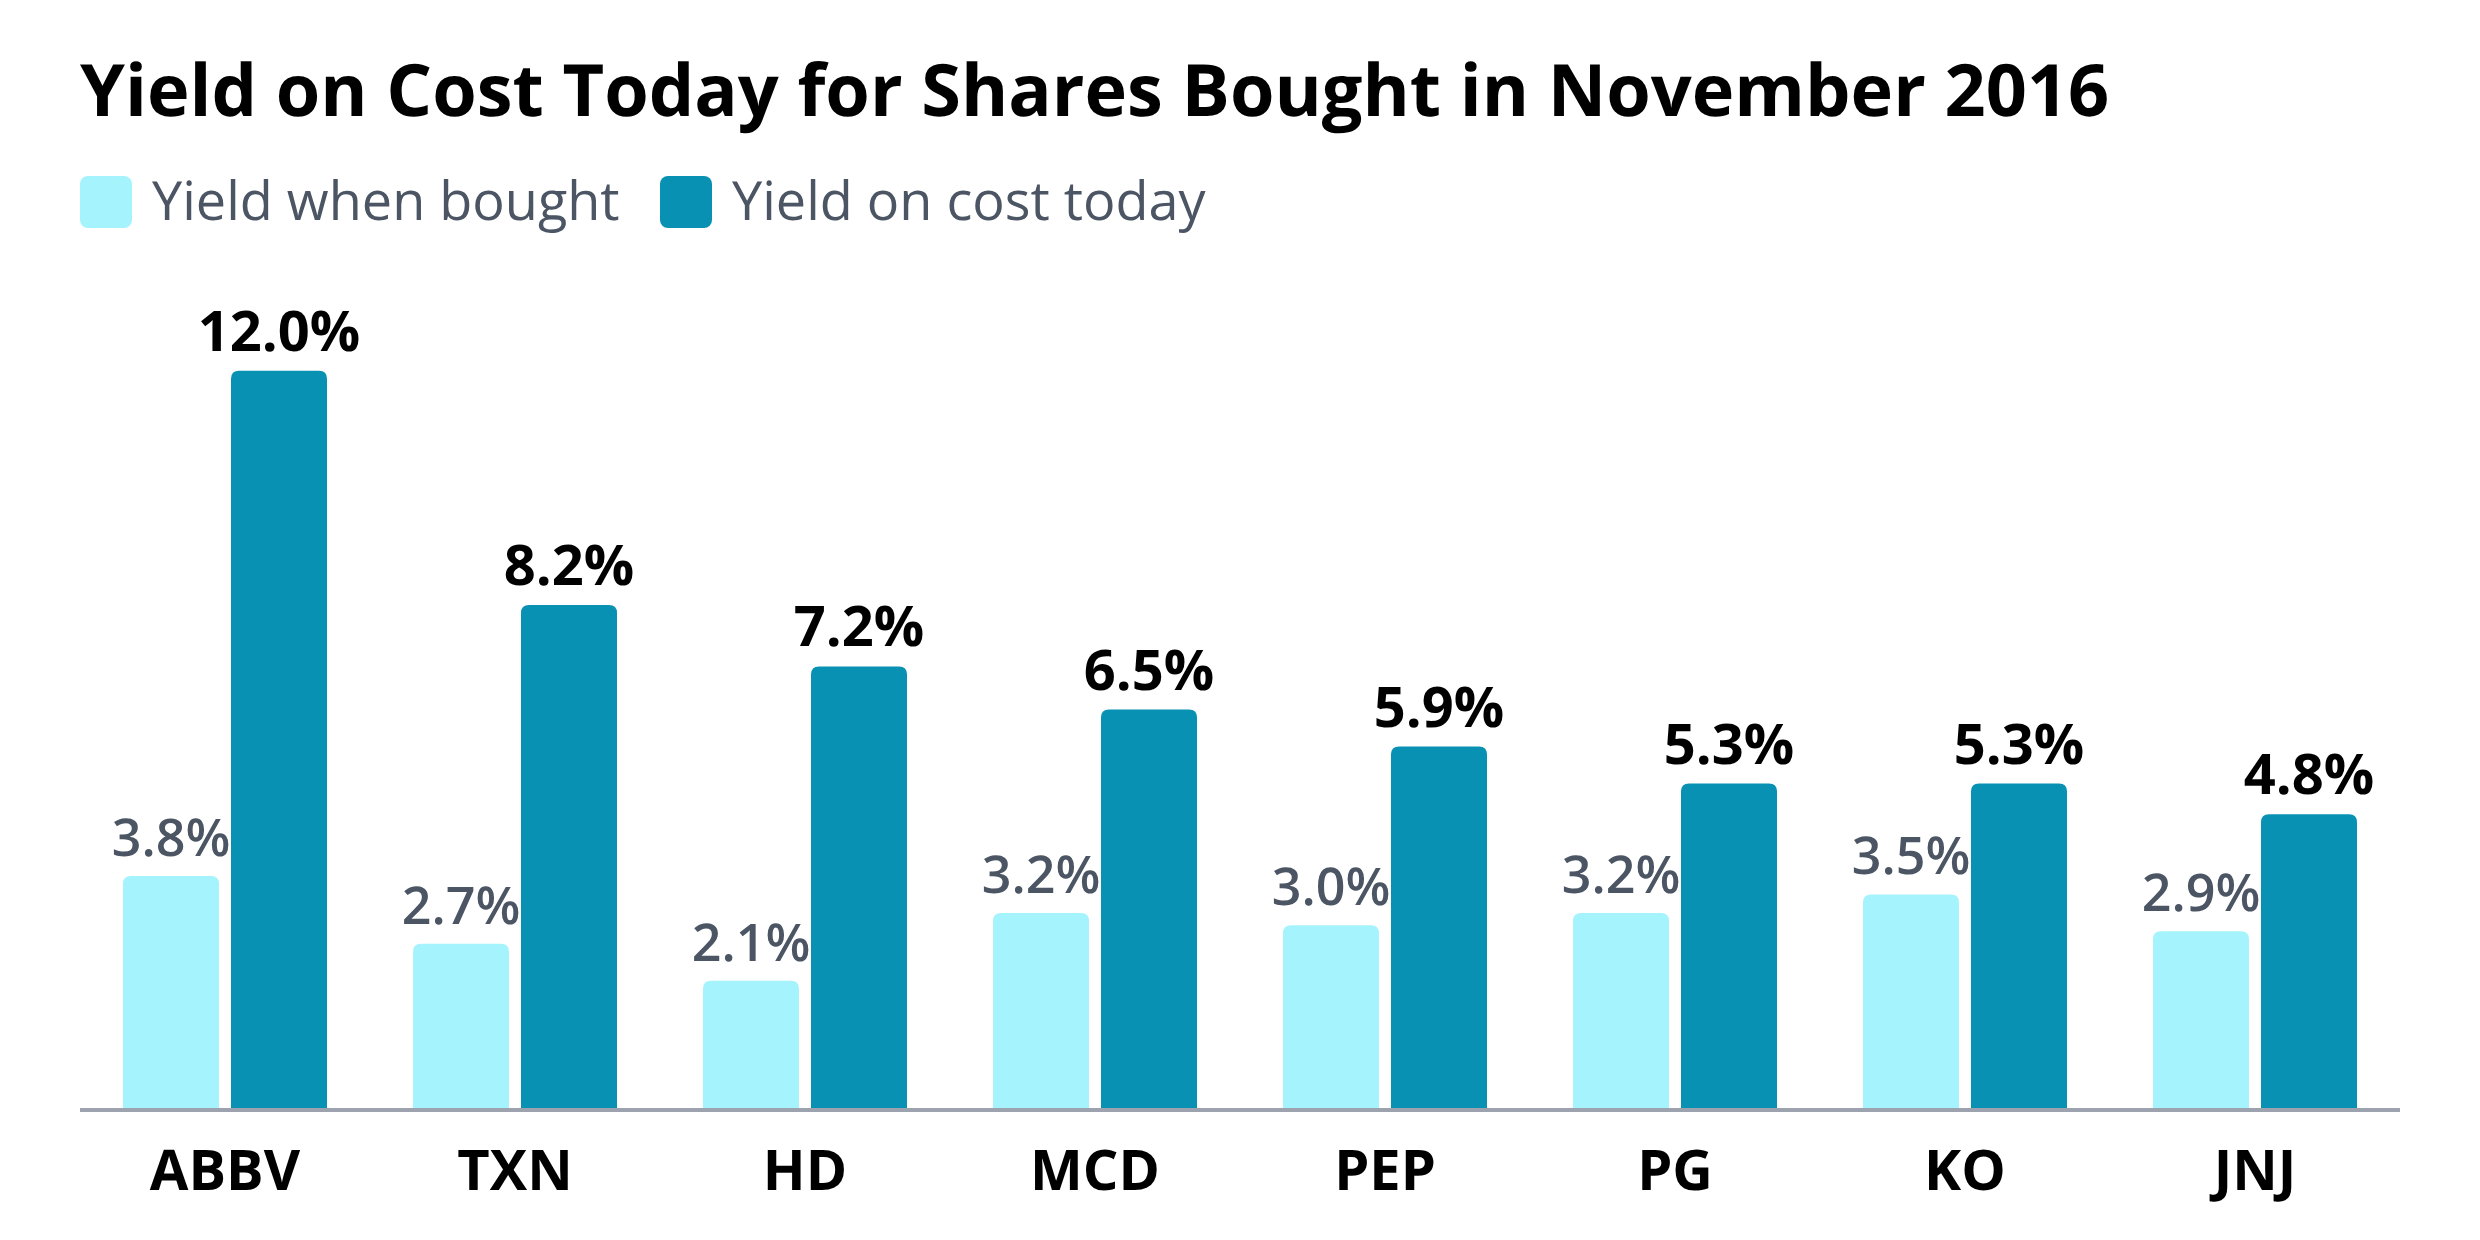
Texas Instruments (TXN) yielded 2.7% when bought. Its dividend has roughly tripled since, so those shares now yield 8.2% on cost. Coca-Cola started with a higher yield, 3.5%, but its slower dividend growth has lifted yield on cost to 5.3%.
AbbVie (ABBV) did both. It started with the highest yield of the group and more than tripled its dividend, which took its yield on cost to 12.0%.
None of those yields is available to a buyer today. Texas Instruments yields 2.0% at today's price and AbbVie 2.5%. Yield on cost describes what already happened to the people who bought years ago.
How Dividend Growth Drives Yield on Cost
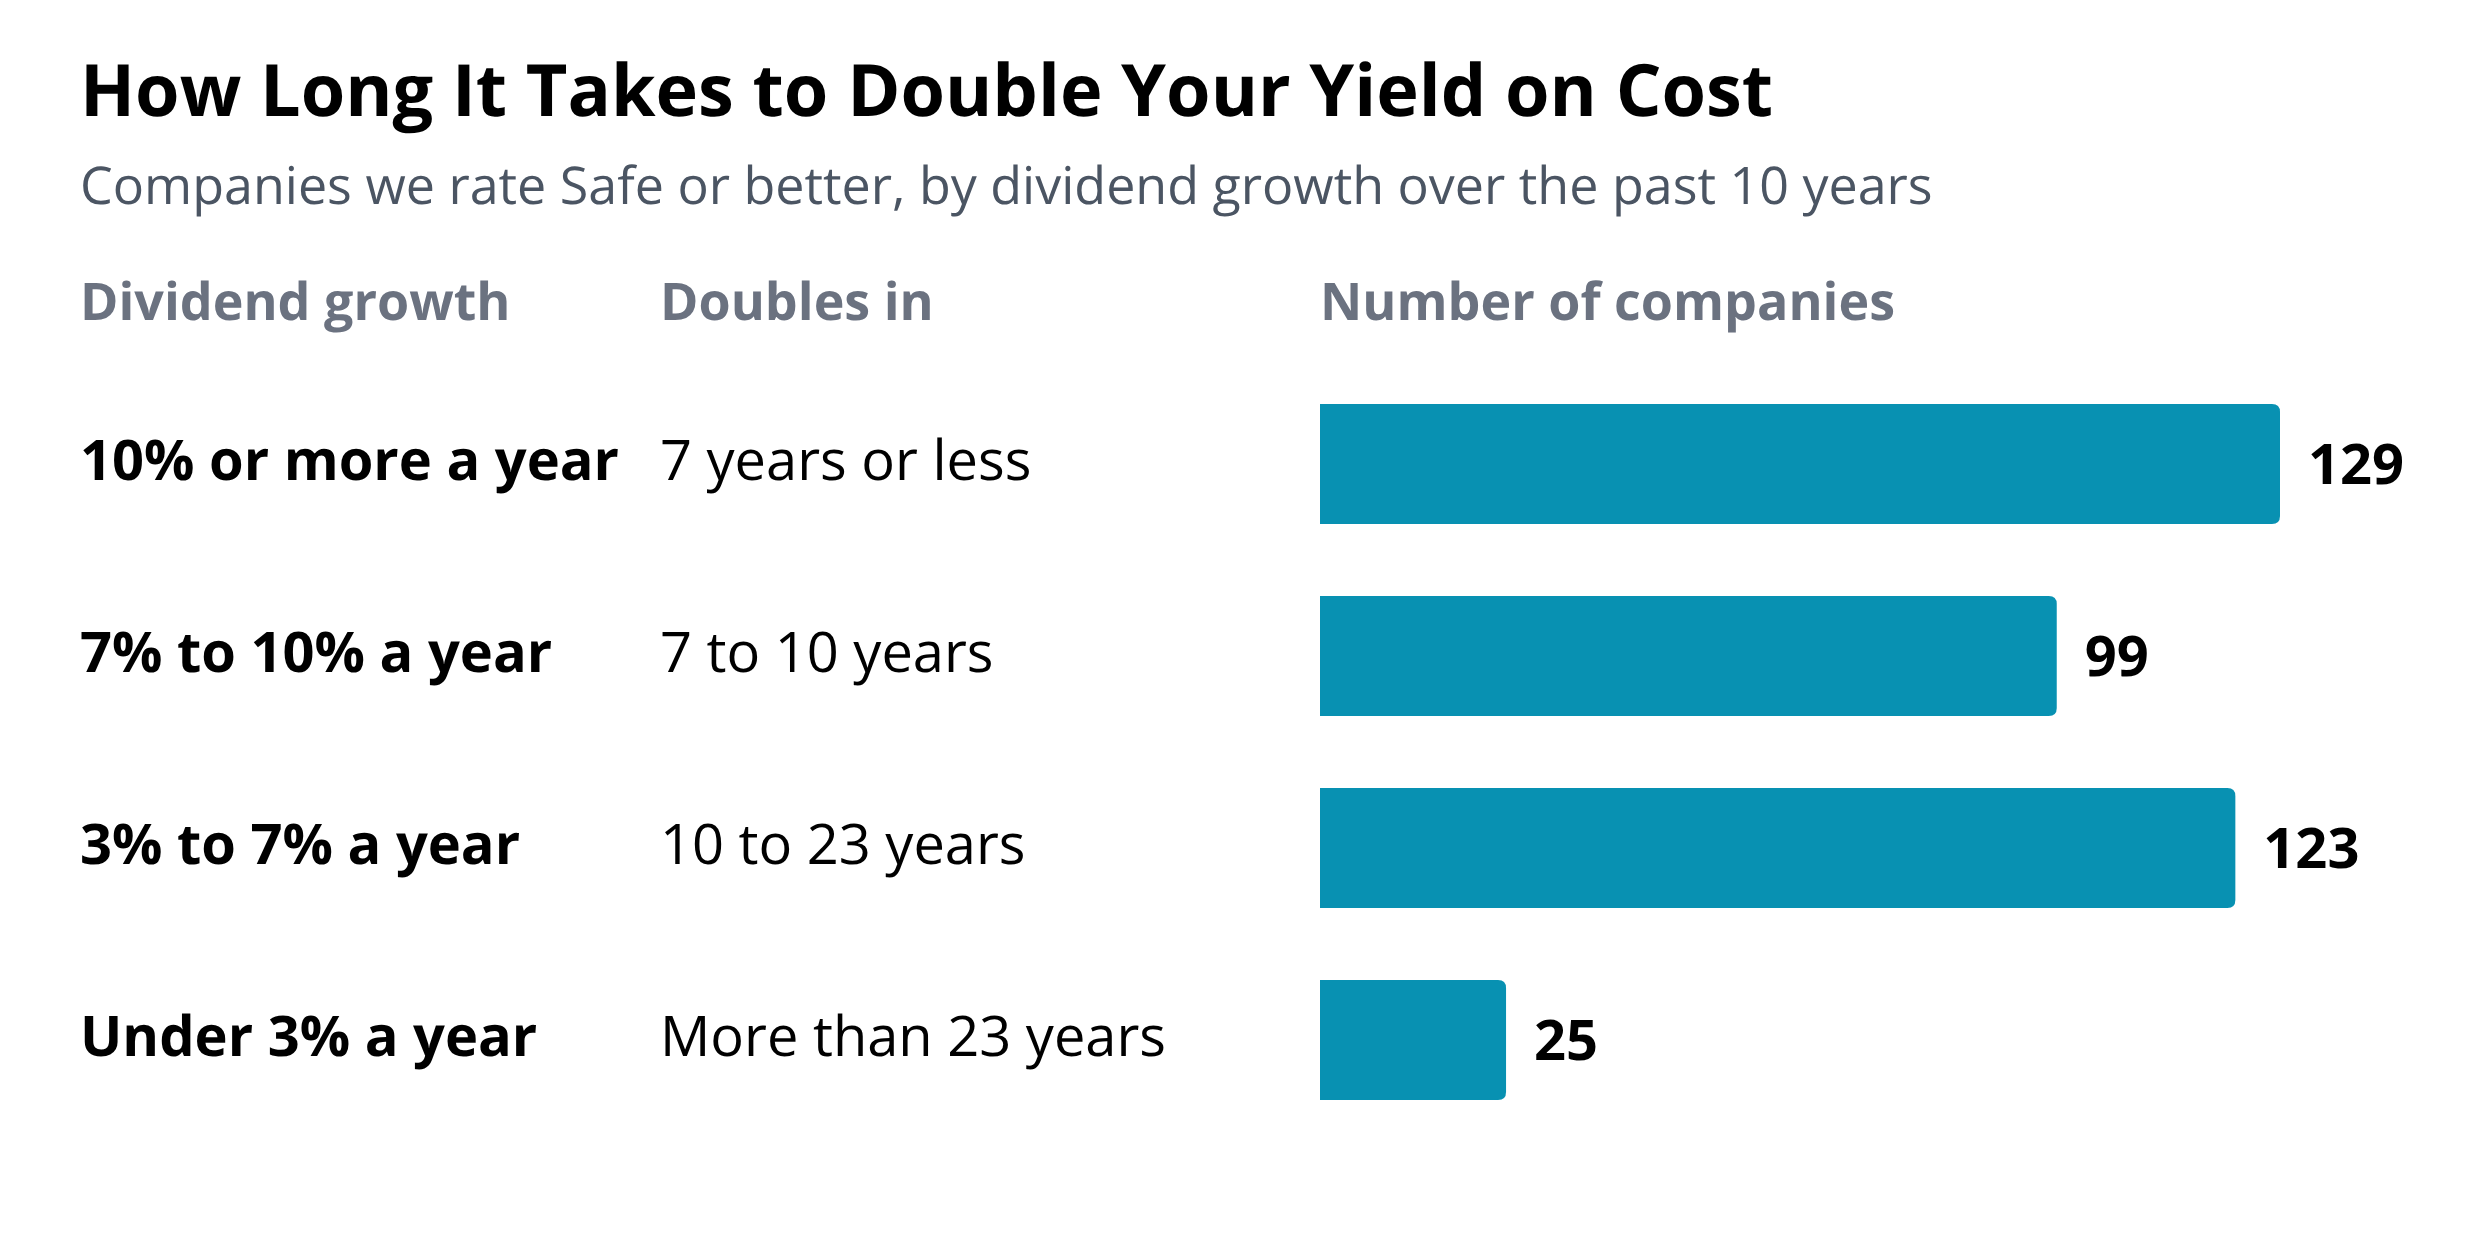
Your yield on cost doubles when the dividend doubles. At 7% dividend growth a year that takes about 10 years. At 3% it takes more than 23 years, and at 10% about seven.
Plenty of dividend stocks grow at the faster rates. Of the 861 companies we rate, 412 have a Safe or Very Safe Dividend Safety Score. The median one has raised its dividend 7.7% a year over the past decade, a pace that doubles yield on cost in a little over nine years.
PepsiCo (PEP) is a good example of steady growth. Its 2026 raise to $5.92 a year was its 54th consecutive annual increase, and the dividend has nearly doubled from an annual rate of $3.01 at the end of 2016.
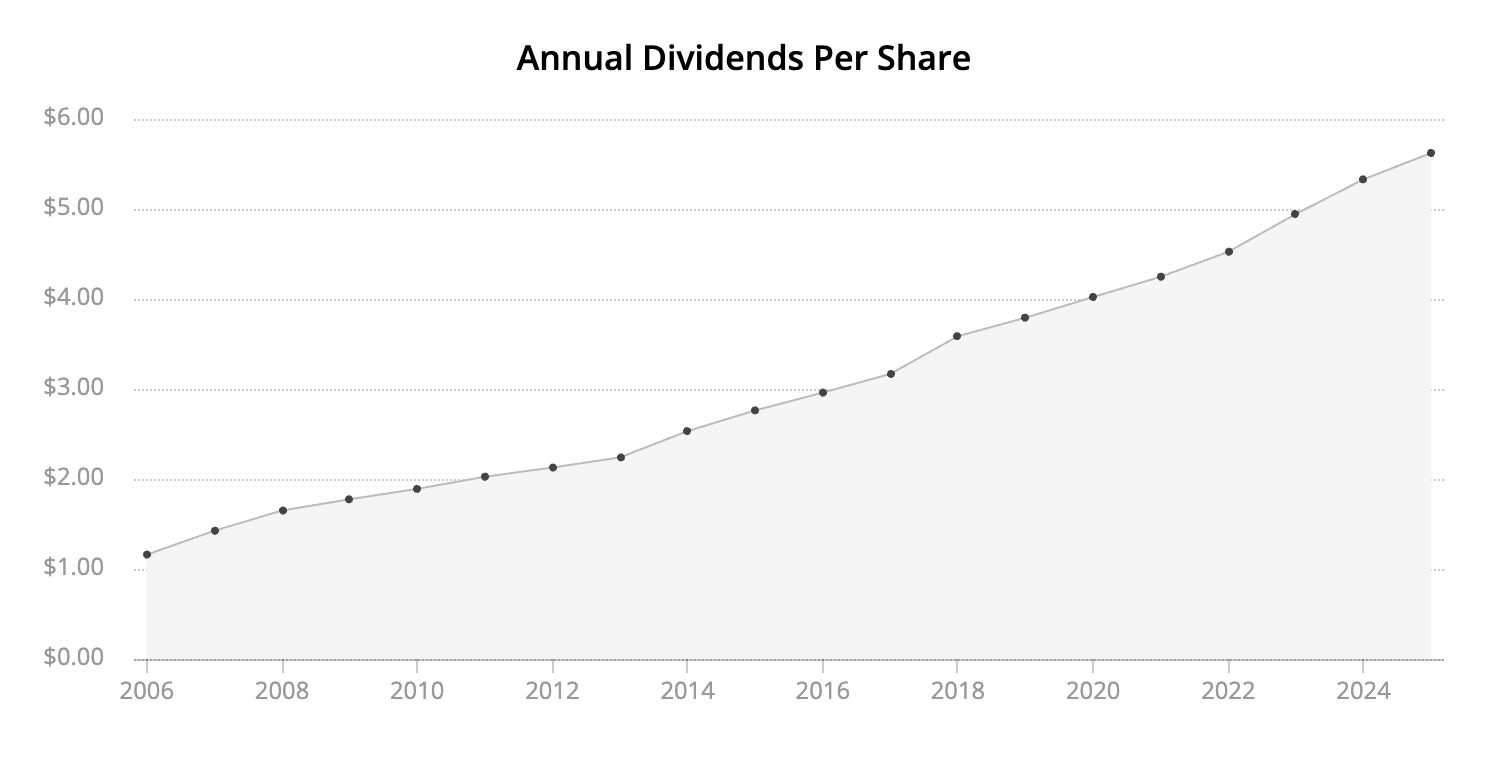
Shares bought then for $100.10 now yield 5.9% on cost, up from 3.0%.
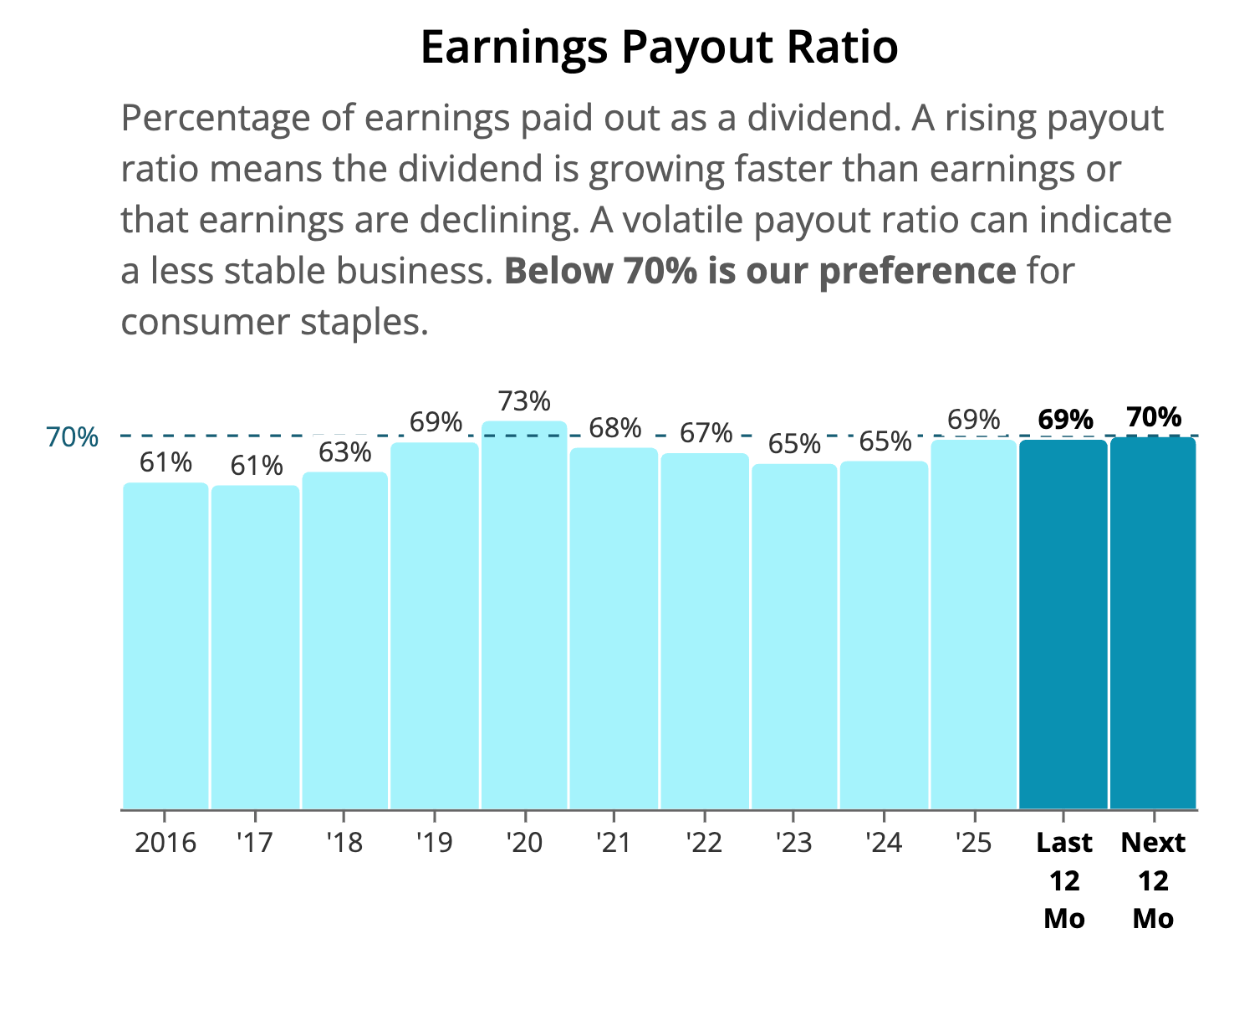
Earnings growth paid for most of those raises. PepsiCo's payout ratio has edged up from 61% of earnings in 2016 to 69% today, and the company earns a Safe Dividend Safety Score with an A+ credit rating.
That rising income is the main advantage dividend growth stocks have over bonds. A 10-year Treasury pays the same coupon every year until it matures, so its yield on cost never moves. That trade-off is why we compared three dividend growers with Treasuries in our video 3 Safe Dividend Machines Paying More Than Treasuries, and our guide to dividend stocks vs. bonds for retirement income covers the rest.
Why a High Yield on Cost Can Disappear
Yield on cost only looks backward, though. It can sit at its highest just before a dividend cut.
Intel (INTC) shows how. Shares bought at the end of November 2016 for $34.70 yielded 3.0%, almost exactly what PepsiCo offered at the time. Intel raised its dividend every year through 2022, which took yield on cost to 4.2%.
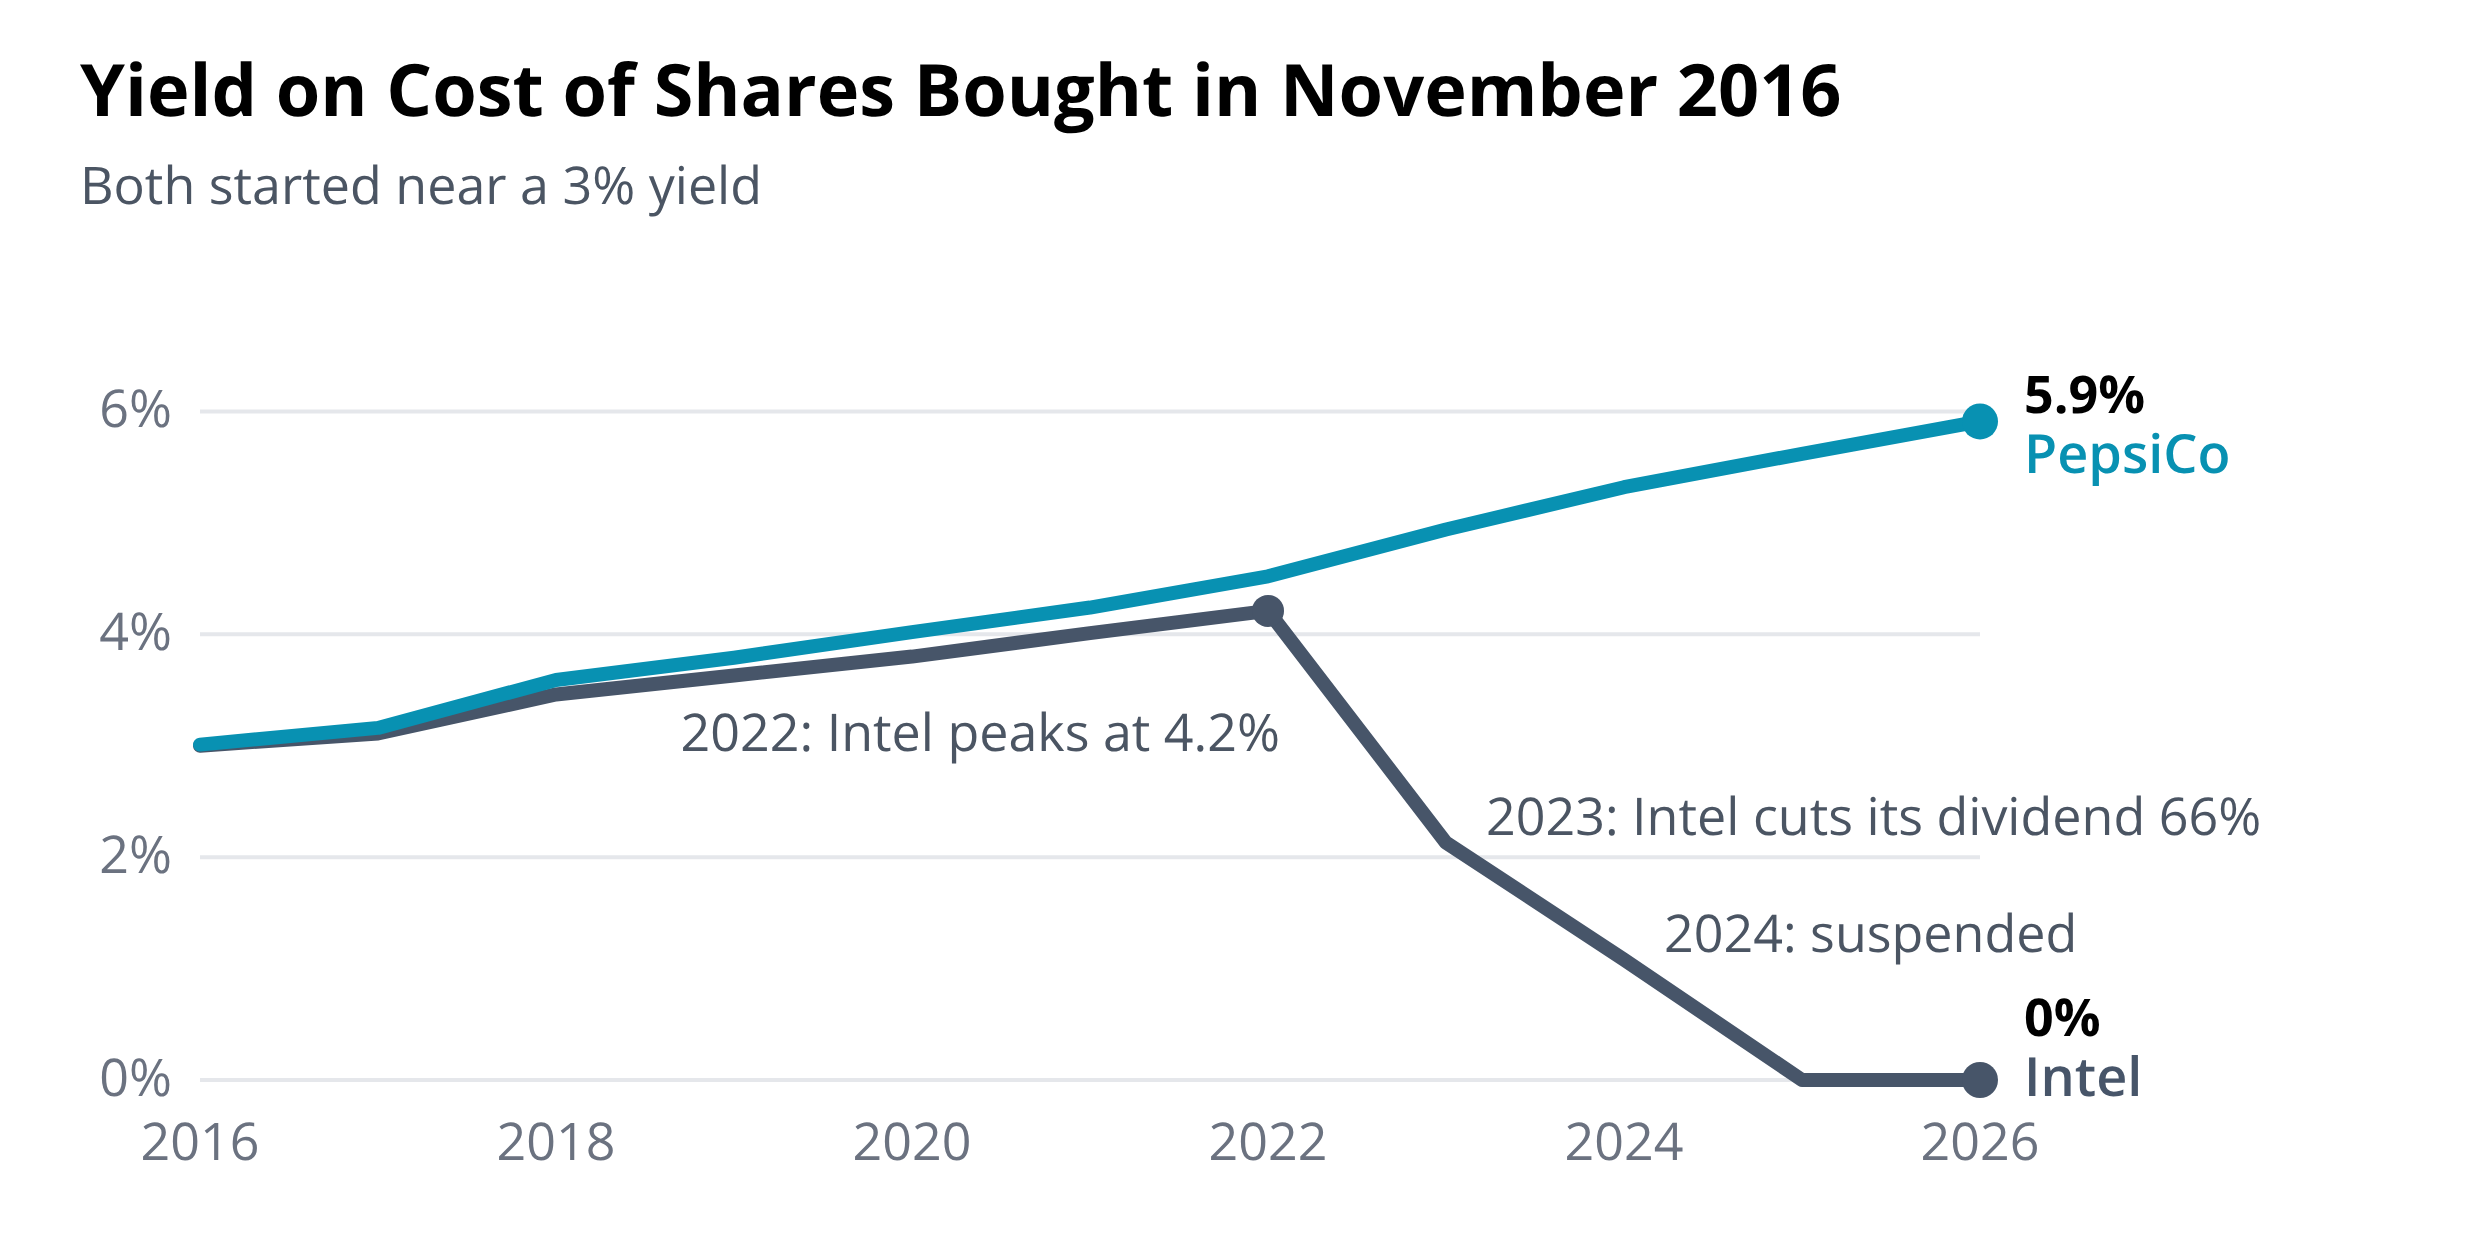
Then the business weakened. Intel cut its dividend 66% in February 2023 to preserve cash for an expensive manufacturing turnaround, and it suspended the dividend in August 2024. The 2016 buyer's yield on cost went from 4.2% to zero in under two years.
Nothing in that 4.2% hinted at the trouble. The warning signs were in the business and its finances. Intel's Dividend Safety Score was Borderline Safe before both cuts, and our Dividend Safety Score track record shows that 929 of the 950 dividend cuts we have tracked since 2015 came from companies we rated below Safe beforehand.
How to Use Yield on Cost (and When to Ignore It)
We treat yield on cost as an output of a good investment process, not an input. It doesn't play a role in our decisions.
The useful questions look forward. Is the dividend safe? Can earnings keep growing to fund future raises? Is the stock reasonably valued at today's price? Dividend Safety Scores and payout ratios help answer the first two.
A high yield on cost is also a poor reason to keep a stock. Every dollar in a holding could be sold and reinvested at today's prices, so the real comparison is the stock's current yield and outlook against your other choices. Our guide on when to sell your stocks covers how we think about that.
Where yield on cost earns its keep is patience. Watching it climb year after year is a reminder of what compounding dividend growth can do, which helps many investors stay the course through market swings, especially in retirement.
Read More: 5 Reasons to Be a Dividend Growth Investor
Frequently Asked Questions
What is yield on cost?
Yield on cost is the annual dividend a stock pays today divided by the price you originally paid per share. Coca-Cola shares bought for $40.35 in late 2016 yield 5.25% on cost at today's $2.12 annual dividend.
Yield on cost is the annual dividend a stock pays today divided by the price you originally paid per share. Coca-Cola shares bought for $40.35 in late 2016 yield 5.25% on cost at today's $2.12 annual dividend.
How do you calculate yield on cost?
Divide the current annual dividend per share by your cost basis per share. For several purchases, divide your total annual dividend income from the stock by your total amount invested in it.
Divide the current annual dividend per share by your cost basis per share. For several purchases, divide your total annual dividend income from the stock by your total amount invested in it.
What is a good yield on cost?
One that rises steadily, driven by safe dividend growth. At 7% annual dividend growth, yield on cost doubles in about 10 years. Shares of Texas Instruments bought in late 2016 at a 2.7% yield now yield 8.2% on cost.
One that rises steadily, driven by safe dividend growth. At 7% annual dividend growth, yield on cost doubles in about 10 years. Shares of Texas Instruments bought in late 2016 at a 2.7% yield now yield 8.2% on cost.
What is the difference between dividend yield and yield on cost?
Dividend yield divides the annual dividend by today's share price, so it changes daily. Yield on cost divides it by the price you paid, so it changes only when the dividend changes or you buy or sell shares.
Dividend yield divides the annual dividend by today's share price, so it changes daily. Yield on cost divides it by the price you paid, so it changes only when the dividend changes or you buy or sell shares.
Does yield on cost include reinvested dividends?
It can. If you reinvest dividends, the new shares add to both your income and your cost basis, so divide total annual dividends by total cost. Our guide to dividend reinvestment plans covers how reinvesting works.
It can. If you reinvest dividends, the new shares add to both your income and your cost basis, so divide total annual dividends by total cost. Our guide to dividend reinvestment plans covers how reinvesting works.
Should you use yield on cost to make investment decisions?
We don't. Yield on cost describes past dividend growth, while buy, hold and sell decisions depend on the dividend's safety, future growth and today's valuation. Intel's yield on cost peaked at 4.2% in 2022, shortly before its dividend was cut and then suspended.
We don't. Yield on cost describes past dividend growth, while buy, hold and sell decisions depend on the dividend's safety, future growth and today's valuation. Intel's yield on cost peaked at 4.2% in 2022, shortly before its dividend was cut and then suspended.
Is there a yield on cost calculator?
The formula is easy to run by hand or in a spreadsheet. Portfolio trackers, including ours, also calculate yield on cost for each holding and for a whole portfolio from your cost basis.
The formula is easy to run by hand or in a spreadsheet. Portfolio trackers, including ours, also calculate yield on cost for each holding and for a whole portfolio from your cost basis.
Want to see the yield on cost of every stock you own, next to its Dividend Safety Score and payout ratio? Our portfolio tools track it for you. Take a look at our demo.