How Much Do I Need to Retire on Dividends?
Ideally, many income investors would love to live entirely off dividends during retirement. That's because a quality portfolio of dividend growth stocks has potential to provide stable income (even during recessions) that rises faster than inflation, thus growing your buying power over time.
Best of all, retiring on dividends means your standard of living no longer depends on fickle and volatile stock prices. Instead of selling off shares and drawing down your principle to make ends meet, dividends have you covered.
But we don't live in an ideal world, and generating meaningful dividend income requires a substantial amount of capital. Many investors want to know whether or not their individual portfolios can make them financially independent during retirement.
In other words, just how much dividend income do you need to live comfortably during your golden years, and how large of a portfolio is required? That's a complicated question, but here's a basic guide that can help you think through some of the biggest factors.
Best of all, retiring on dividends means your standard of living no longer depends on fickle and volatile stock prices. Instead of selling off shares and drawing down your principle to make ends meet, dividends have you covered.
But we don't live in an ideal world, and generating meaningful dividend income requires a substantial amount of capital. Many investors want to know whether or not their individual portfolios can make them financially independent during retirement.
In other words, just how much dividend income do you need to live comfortably during your golden years, and how large of a portfolio is required? That's a complicated question, but here's a basic guide that can help you think through some of the biggest factors.
How Much Do I Need to Live Comfortably During Retirement?
The first step in determining if you can retire on dividends is to estimate how much retirement is going to cost you. The answer is different for everyone and depends on numerous factors including:
- Age you want to retire
- Your health at the time
- How your health changes post retirement
- How long you'll live
- Unexpected medical expenses
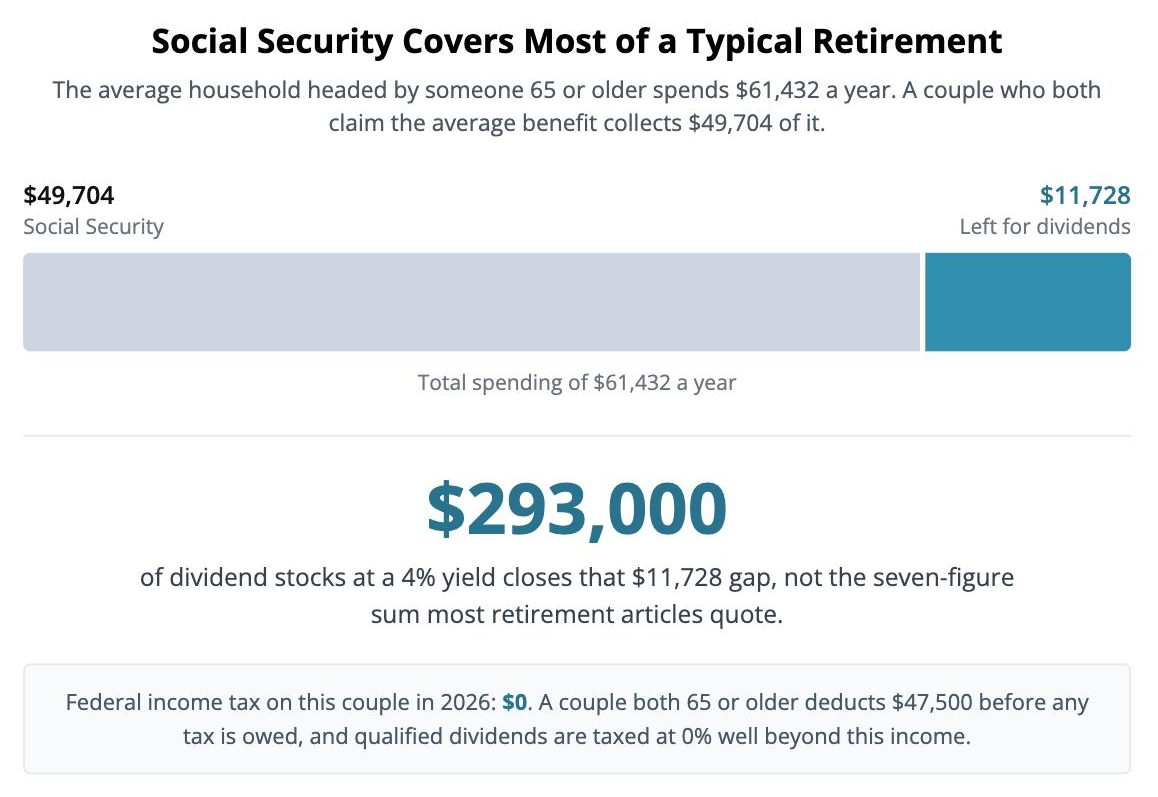
The average household headed by someone 65 or older spends $61,432 a year, according to the most recent Consumer Expenditure Survey from the U.S. Bureau of Labor Statistics. That is an average, and your number will move with the cost of living where you are, property taxes and health.
Social Security covers a large share of it. The average retired worker collects $2,071 a month as of January 2026, or about $24,852 a year, and a couple who both worked and claim similar benefits receives roughly $49,704.
That leaves a couple spending the national average about $11,728 short each year. That gap, not the whole $61,432, is what your portfolio has to produce.
Another popular rule of thumb is that you should plan for Social Security plus investment income (dividends and capital gains) to equal about 80% of your last year's working income. That's based on the assumption that when you're retired you'll have slightly lower costs for things like clothing and commuting to work.
However, you can't necessarily count on lower expenses in retirement. A 2017 study by the Employee Benefit Research Institute found that:
However, you can't necessarily count on lower expenses in retirement. A 2017 study by the Employee Benefit Research Institute found that:
- 46% of retired households spend more in the first two years
- 28% of retired households spend 20+% more
- By year six of retirement, 33% of couples are still spending more
- By year six of retirement, 23% of couples are spending 20+% more
The U.S. Bureau of Labor Statistics data may also be understating long-term retirement costs because thus far relatively few Americans are over the age of 80, when the need for assisted living soars. At some point, it's estimated that 70% of people will need assisted living of some kind, which can be incredibly expensive.
CareScout, which took over Genworth’s Cost of Care Survey, put the 2025 national medians at $6,200 a month for a private one-bedroom in an assisted living community, which is $74,400 a year. A semi-private nursing home room runs $315 a day, or $114,975 a year, and a private room $355 a day, or $129,575.
In-home care is no cheaper. A non-medical caregiver costs a median $35 an hour, about $80,080 a year at 44 hours a week.
Those figures have climbed sharply. Assisted living cost roughly $48,000 a year in the 2018 survey and nursing home care about $89,000, so both are up more than half in seven years. Long-term care inflation, not grocery inflation, is what breaks retirement plans.
CareScout, which took over Genworth’s Cost of Care Survey, put the 2025 national medians at $6,200 a month for a private one-bedroom in an assisted living community, which is $74,400 a year. A semi-private nursing home room runs $315 a day, or $114,975 a year, and a private room $355 a day, or $129,575.
In-home care is no cheaper. A non-medical caregiver costs a median $35 an hour, about $80,080 a year at 44 hours a week.
Those figures have climbed sharply. Assisted living cost roughly $48,000 a year in the 2018 survey and nursing home care about $89,000, so both are up more than half in seven years. Long-term care inflation, not grocery inflation, is what breaks retirement plans.
What's more, medical expense inflation is running at about double the rate of overall inflation, a 30-year trend that's expected to continue. That's why, according to HealthView Services, a provider of healthcare cost-projection software, the average healthy 65-year-old couple retiring today will likely face $363,946 in lifetime Medicare and supplemental insurance premiums and out-of-pocket medical expenses (in today's dollars).
Merrill Lynch Bank of America puts that figure at $259,000 for a married couple that "wants to have 90% certainty that they can cover their out-of-pocket health-related expenses in retirement." Healthcare doesn't come cheap.
Merrill Lynch Bank of America puts that figure at $259,000 for a married couple that "wants to have 90% certainty that they can cover their out-of-pocket health-related expenses in retirement." Healthcare doesn't come cheap.
Simply put, retirement costs are complex. But at a bare minimum the average American couple may need to plan for $14,500 per year in annual income from their portfolio, and preferably far more in the case of health disruptions, longer life expectancies, or even long-term changes to Social Security benefits.
But what does that mean in terms of portfolio size and whether dividends can bridge that supplemental income gap?
But what does that mean in terms of portfolio size and whether dividends can bridge that supplemental income gap?
How Big of a Dividend Portfolio Do You Need to Fund a Comfortable Retirement?
There are many popular rules of thumb for determining how large of a nest egg you need to fund a comfortable retirement and not risk running out of money. Approximately 39% of people believe the ideal retirement savings amount is between $100,000 and $250,000, according to a 2018 Gobankingrate.com survey of 1,000 Americans.
Unfortunately, a nest egg of that size appears insufficient to ensure a comfortable retirement for most folks. Fidelity's rule of thumb is to have savings (cash, bonds, stocks) equal to at least 10 times your final year's income, assuming you want to retire at 67.
This takes into account out-of-pocket medical expenses during the typical 30-year retirement. Median household income was $83,730 in 2024, so under Fidelity’s rule of thumb the typical household should enter retirement with roughly $837,300 saved.
Unfortunately, a nest egg of that size appears insufficient to ensure a comfortable retirement for most folks. Fidelity's rule of thumb is to have savings (cash, bonds, stocks) equal to at least 10 times your final year's income, assuming you want to retire at 67.
This takes into account out-of-pocket medical expenses during the typical 30-year retirement. Median household income was $83,730 in 2024, so under Fidelity’s rule of thumb the typical household should enter retirement with roughly $837,300 saved.
That may even be too low. A Merrill Lynch Finances in Retirement Survey put the figure at $738,400 for the average retired couple, though that estimate dates to 2017 and has not kept pace with what retirement now costs.
But what are these rules of thumbs and estimates based on? That would be the 4% rule. The 4% rule simply states that if you sell 4% of your portfolio at the start of your retirement, and then adjust that for inflation each year, you're unlikely to run out of money over a 30-year retirement.
The rule is based on a 1994 study by CPA William Bengen who looked at annual market data (stocks and bonds) going back to 1926. Assuming a 60%/40% portfolio of stocks and bonds, this 4% withdrawal rate has become the cornerstone for most retirement savings estimates.
But what are these rules of thumbs and estimates based on? That would be the 4% rule. The 4% rule simply states that if you sell 4% of your portfolio at the start of your retirement, and then adjust that for inflation each year, you're unlikely to run out of money over a 30-year retirement.
The rule is based on a 1994 study by CPA William Bengen who looked at annual market data (stocks and bonds) going back to 1926. Assuming a 60%/40% portfolio of stocks and bonds, this 4% withdrawal rate has become the cornerstone for most retirement savings estimates.
While the 4% rule has many limitations it can serve as a rough approximation for determining whether or not you have sufficient retirement savings. For example, the $100,000 to $250,000 "ideal" savings that 39% of Americans seem to believe in would generate just $4,000 to $10,000 in annual income.
Remember that using the most recent median retired household spending data we have from the U.S. Bureau of Labor Statistics, a couple needs at least $14,500 per year in supplemental portfolio income to make ends meet.
Under the Fidelity and Merrill Lynch estimates the 4% rule would generate $24,980 and $29,536 in annual income, respectively. That's far above our $14,500 minimum estimate which helps to provide a safety buffer against unexpected medical expenses or higher living costs which so many retirees end up facing.
Remember that using the most recent median retired household spending data we have from the U.S. Bureau of Labor Statistics, a couple needs at least $14,500 per year in supplemental portfolio income to make ends meet.
Under the Fidelity and Merrill Lynch estimates the 4% rule would generate $24,980 and $29,536 in annual income, respectively. That's far above our $14,500 minimum estimate which helps to provide a safety buffer against unexpected medical expenses or higher living costs which so many retirees end up facing.
Which brings us to the issue of funding a retirement with dividends, which can theoretically replace the 4% rule. That's because the 4% rule requires you to sell your income producing assets (stocks and bonds) while a 4% yielding dividend portfolio means you don't have to sell stocks at all.
Since stocks tend to appreciate over time, retiring on dividends can be an appealing choice if you can manage it and understand the risks. But assessing whether or not you can actually achieve this ideal situation, like most things with retirement planning, can get complicated.
Since stocks tend to appreciate over time, retiring on dividends can be an appealing choice if you can manage it and understand the risks. But assessing whether or not you can actually achieve this ideal situation, like most things with retirement planning, can get complicated.
How Much You Need at Each Yield
Portfolio size is just your income gap divided by the yield you can earn safely. We checked what that yield actually is by screening every company we cover, and the answer today is about 4.65% for a diversified portfolio of stocks we rate Safe or better, or roughly 4% if you want more room for error.
The full screen behind those numbers is in How to Live Off Dividends. Here is what they mean for portfolio size.
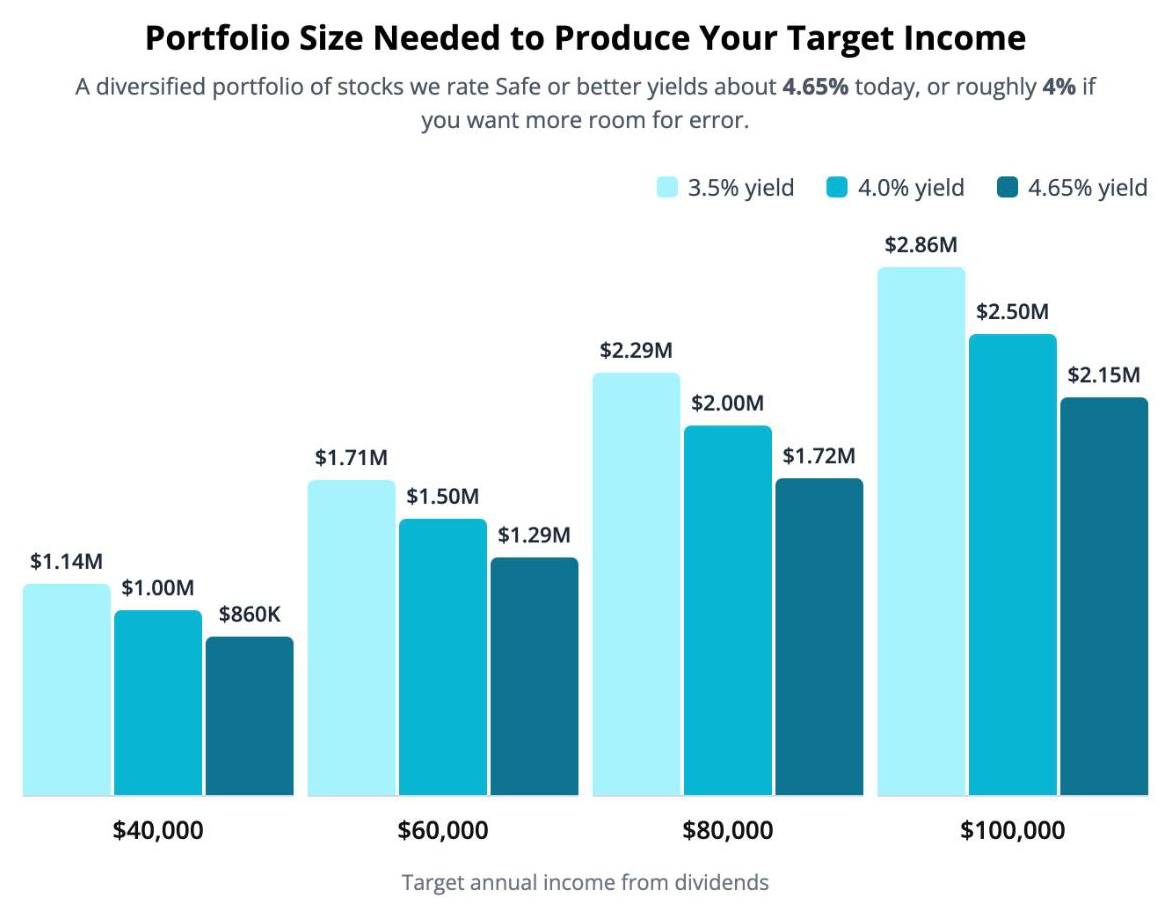
Target income of $40,000 a year
About $1.14 million at a 3.5% yield, $1.00 million at 4%, or $860,000 at 4.65%
Target income of $60,000 a year
About $1.71 million at 3.5%, $1.50 million at 4%, or $1.29 million at 4.65%
About $1.71 million at 3.5%, $1.50 million at 4%, or $1.29 million at 4.65%
Target income of $80,000 a year
About $2.29 million at 3.5%, $2.00 million at 4%, or $1.72 million at 4.65%
About $2.29 million at 3.5%, $2.00 million at 4%, or $1.72 million at 4.65%
Target income of $100,000 a year
About $2.86 million at 3.5%, $2.50 million at 4%, or $2.15 million at 4.65%
About $2.86 million at 3.5%, $2.50 million at 4%, or $2.15 million at 4.65%
Those figures assume dividends are your only income, which is rarely true. Subtract Social Security first and the numbers fall sharply.
A couple both drawing the average benefit and spending the national average needs about $11,728 a year from investments. At a 4% yield that is roughly $293,000 of dividend stocks, not the seven-figure sum most retirement articles quote.
We built exactly that portfolio to check the numbers. Thirty stocks we rate Safe or better, no sector above 10% of the total, spread across eleven sectors and funded with $1 million.
It produces $46,503 a year, a 4.65% yield, with a beta of 0.65. Every dollar of that income comes from companies we rate Safe or Very Safe.
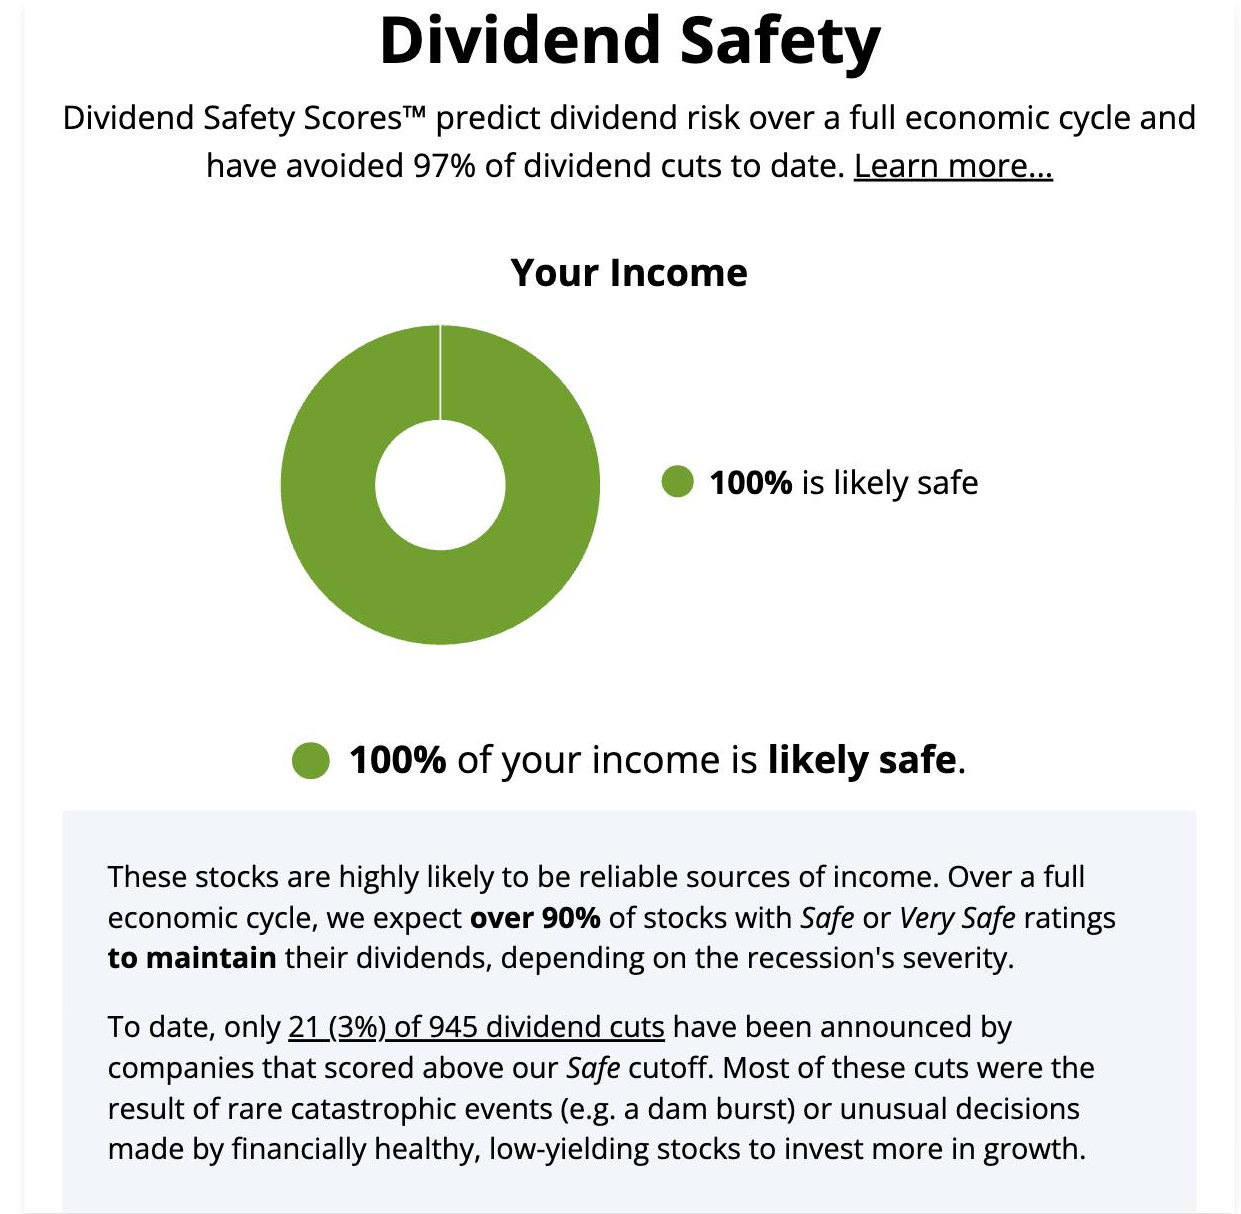
The dividends behind it have grown 3.8% a year over the past five years, which is roughly inflation plus a little. That is the realistic trade for a portfolio built to prioritize safe income today over faster growth later.
This is why the honest answer to how much you need is always a subtraction problem before it is a multiplication problem.
What Taxes Do to These Numbers
Spending is money that has already been taxed. Social Security and dividends are not, so the fair question is what the portfolio has to produce before tax rather than after.
For a retired couple living on the numbers above, the answer is that almost nothing changes.
A couple who are both 65 or older subtract $47,500 from their income in 2026 before any federal tax is owed. That is the $32,200 standard deduction, another $1,650 each for being 65 or older, and the $6,000 per person senior deduction Congress added for 2025 through 2028.
Qualified dividends are then taxed at 0% until taxable income passes $98,900.
Run our couple through that. Their $11,728 of dividends pulls $2,290 of Social Security into the taxable calculation, which leaves adjusted gross income of $14,018, far below the $47,500 they can deduct.
They owe no federal income tax, so the gap is the same number before tax and after it.
The same holds further up the table. A couple collecting $100,000 of qualified dividends on top of two average benefits lands at $94,748 of taxable income, still under the line where the rate on those dividends changes from 0% to 15%.
Four things move that answer, and they are worth checking against your own situation:
- Income that is not qualified. In the portfolio above, we classify about 16% of the income as non-qualified, mostly the REITs and the business development company, with another 8% arriving on partnership K-1s. That share is taxed as ordinary income.
- The account it sits in. Withdrawals from a traditional IRA or 401(k) are ordinary income no matter what produced them, which is a different calculation from the one above.
- Where you live. Some states tax dividend income, and a handful still reach Social Security.
- Crossing the line. Above $98,900 of taxable income the rate on qualified dividends becomes 15%, and higher income can also lift Medicare premiums two years later.
We are not tax advisors and none of this is tax advice. It is the arithmetic behind the figures in this guide, and your own return will look different enough to be worth an hour with a professional.
Some Important Factors to Consider
There are two important issues to consider for anyone wanting to retire on dividends. The first is overall asset allocation. That simply means your portfolio's mix of stocks, bonds, and cash equivalents (like short-term Treasury bills, money market accounts, CDs, or high-yield savings accounts). Each of these assets serves a slightly different but important role:
- Cash is for short to medium-term expenses and is used to fill any gaps during market downturns (to avoid selling stocks at depressed levels)
- Bonds usually provide the safest income and are usually far less volatile than stocks, helping soften portfolio drawdowns during bear markets to help investors stay the course
- Stocks provide both income and long-term capital gains because they are the fastest appreciating asset class, historically speaking
Even most retirees should still maintain exposure to stocks to ensure their nest eggs doesn't run out, but as you get older many advisers recommend a more conservative asset allocation with a greater emphasis on bonds and cash.
- A $500,000 portfolio produces about $23,250 a year
- $837,300, the Fidelity ten-times rule applied to median household income, produces about $38,934
- $1 million produces about $46,500
- $1.5 million produces about $69,750
At first glance, it appears that even the median retired couple could afford to live off Social Security and dividends if they invest their entire savings in stocks that pay 10% or higher dividend yields.
However, this would likely be a disastrous idea because many stocks with such high payouts end up being yield traps, or companies with unsafe dividends that are at higher risk of being cut in the future.
Our own coverage makes the point bluntly. Of the 867 companies we rate, 58 currently yield 10% or more, and not one of them scores Safe or better. Two are Borderline Safe and the other 56 are Unsafe.
The highest-yielding stock we rate Safe or better is Enterprise Products Partners at 5.76%. That is the practical ceiling, and any plan built on a double-digit yield is a plan built on dividends we expect to be cut.
It's true that some stocks, like business development companies and mortgage REITs, do often pay 10% yields, sometimes for many years. But these are financial companies whose payouts are typically variable over the long term with high sensitivity to interest rates and the economy's health.
In other words, a high concentration of double-digit-yielding mortgage REITs and business development companies is a bad idea because most of these end up reducing their dividends during recessions. Some mortgage REITs even do so during bull markets depending on what interest rates are doing.
However, this would likely be a disastrous idea because many stocks with such high payouts end up being yield traps, or companies with unsafe dividends that are at higher risk of being cut in the future.
Our own coverage makes the point bluntly. Of the 867 companies we rate, 58 currently yield 10% or more, and not one of them scores Safe or better. Two are Borderline Safe and the other 56 are Unsafe.
The highest-yielding stock we rate Safe or better is Enterprise Products Partners at 5.76%. That is the practical ceiling, and any plan built on a double-digit yield is a plan built on dividends we expect to be cut.
It's true that some stocks, like business development companies and mortgage REITs, do often pay 10% yields, sometimes for many years. But these are financial companies whose payouts are typically variable over the long term with high sensitivity to interest rates and the economy's health.
In other words, a high concentration of double-digit-yielding mortgage REITs and business development companies is a bad idea because most of these end up reducing their dividends during recessions. Some mortgage REITs even do so during bull markets depending on what interest rates are doing.
Another matter to consider is that pass-through businesses such as REITs, BDCs and MLPs are taxed differently from the qualified dividends that corporations pay, which the tax section above works through.
See this comprehensive tax guide for all the details, but in general (with the exception of MLPs which have their own unique tax treatment) most pass-through stocks pay non-qualified dividends that are taxed at your top marginal income tax rate rather than the lower long-term capital gains rates.
See this comprehensive tax guide for all the details, but in general (with the exception of MLPs which have their own unique tax treatment) most pass-through stocks pay non-qualified dividends that are taxed at your top marginal income tax rate rather than the lower long-term capital gains rates.
But what about quality pass-through stocks? Can't dividend investors just own the safest REITs, MLPs, BDCs, and YieldCos? While that is certainly an option and would likely result in a dividend portfolio that yields 6% to 8%, an investor following this approach is still taking on high risk by ignoring the importance of diversification.
When building a quality dividend portfolio we prefer not to have more than 25% of our portfolio allocated to any one sector. That's because any sector can potentially face highly negative effects, such as changes in tax policy or regulations that can potentially disrupt even blue-chip business models.
For example, MLPs have been forced by numerous factors (including regulatory changes and a prolonged bear market) to adapt their traditional business models to focus on using lower leverage, maintaining higher distribution coverage ratios, and self-funding their growth projects.
For many MLPs, this meant having to cut their payouts significantly. While today the industry's fundamentals are much improved, the last four years of significant investor losses (and payout cuts) show that you don't want to rely on any one sector for too much of your retirement income.
When building a quality dividend portfolio we prefer not to have more than 25% of our portfolio allocated to any one sector. That's because any sector can potentially face highly negative effects, such as changes in tax policy or regulations that can potentially disrupt even blue-chip business models.
For example, MLPs have been forced by numerous factors (including regulatory changes and a prolonged bear market) to adapt their traditional business models to focus on using lower leverage, maintaining higher distribution coverage ratios, and self-funding their growth projects.
For many MLPs, this meant having to cut their payouts significantly. While today the industry's fundamentals are much improved, the last four years of significant investor losses (and payout cuts) show that you don't want to rely on any one sector for too much of your retirement income.
REITs are another example. While this group of companies has historically delivered solid long-term returns and income growth, this high-yield sector has seen catastrophe in the past.
That's because REITs, like all pass-through stocks, require strong access to debt and equity markets to fund their growth (very little cash flow is leftover after paying dividends thanks to their required high payout ratios).
During the financial crisis the REIT sector was very highly leveraged. As credit markets slammed shut, from May 2008 through March 2009 about 30% of all REITs suspended, cut, or switched to paying part of their dividend in company stock, according to The Wall Street Journal.
In addition to so many dividend cuts, the REIT sector saw peak losses of 70% during the Great Recession, compared to 57% for the S&P 500. In other words, not just did most REITs fail income investors at their primary job (safe and rising dividends), they also cost them a great amount of sleep during the crisis.
That's because REITs, like all pass-through stocks, require strong access to debt and equity markets to fund their growth (very little cash flow is leftover after paying dividends thanks to their required high payout ratios).
During the financial crisis the REIT sector was very highly leveraged. As credit markets slammed shut, from May 2008 through March 2009 about 30% of all REITs suspended, cut, or switched to paying part of their dividend in company stock, according to The Wall Street Journal.
In addition to so many dividend cuts, the REIT sector saw peak losses of 70% during the Great Recession, compared to 57% for the S&P 500. In other words, not just did most REITs fail income investors at their primary job (safe and rising dividends), they also cost them a great amount of sleep during the crisis.
Today most REITs use much less financial leverage, which means another Great Recession dividend cut wave is unlikely to repeat. However, the above two examples underscore why investors need to own a diversified portfolio of quality dividend growth stocks and can't rely too much on just one or two high-yield sectors for their income.
This is why Simply Safe Dividends' Conservative Retirees portfolio targets a 3.5% to 4.5% dividend yield with 4% to 6% long-term dividend growth (two to three times the rate of inflation). The portfolio also caps its exposure to any single sector at 25% and places heavy emphasis on dividend safety.
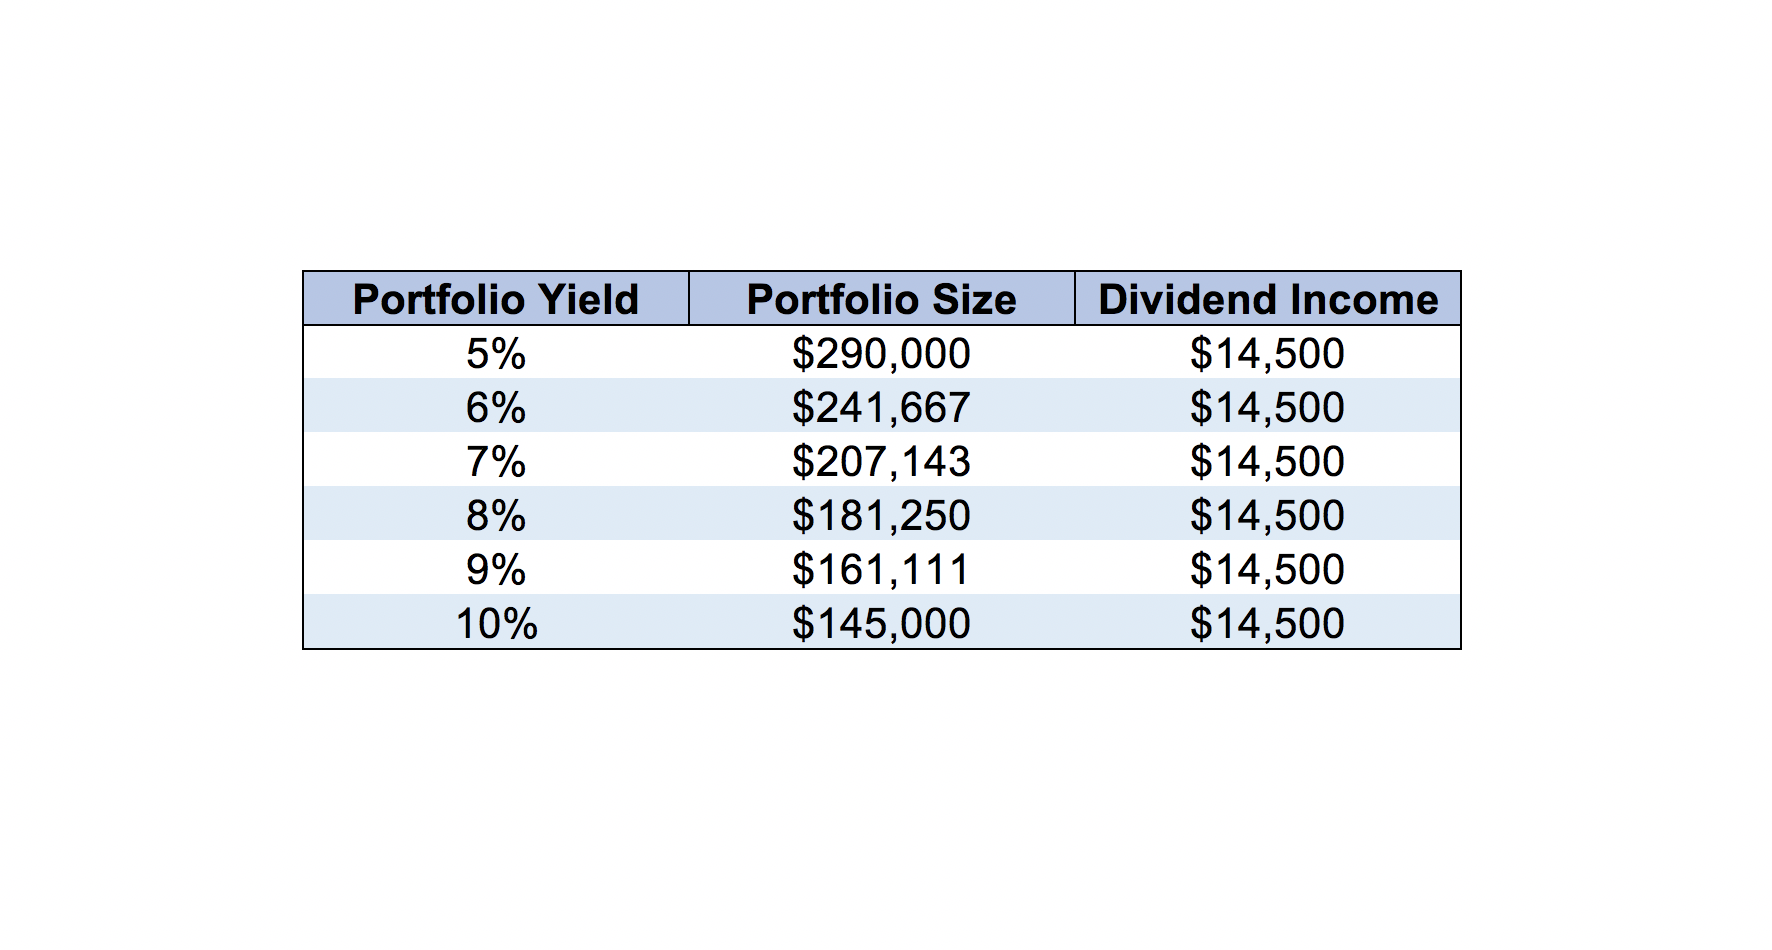
In order to supply $14,500 per year in dividends, a conservative portfolio that yields 4% to 5% requires a starting size of at least $290,000. If those numbers seem difficult to achieve, you could consider increasing income outside of your portfolio (perhaps a part-time job to explore a new interest), looking for ways to reduce expenses, or perhaps delaying retirement.
But teaching for yield is a dangerous game to try and make the numbers work. Retirement could last several decades, and your investment strategy should take a similar long-term outlook that is sustainable.
This is why Simply Safe Dividends' Conservative Retirees portfolio targets a 3.5% to 4.5% dividend yield with 4% to 6% long-term dividend growth (two to three times the rate of inflation). The portfolio also caps its exposure to any single sector at 25% and places heavy emphasis on dividend safety.
In order to supply $14,500 per year in dividends, a conservative portfolio that yields 4% to 5% requires a starting size of at least $290,000. If those numbers seem difficult to achieve, you could consider increasing income outside of your portfolio (perhaps a part-time job to explore a new interest), looking for ways to reduce expenses, or perhaps delaying retirement.
But teaching for yield is a dangerous game to try and make the numbers work. Retirement could last several decades, and your investment strategy should take a similar long-term outlook that is sustainable.
Frequently Asked Questions
Is $1 million enough to retire on dividends?
For many households, yes. At a 4.65% yield, $1 million produces about $46,500 a year. Add the roughly $49,704 a couple collects from average Social Security benefits and the household has around $96,000 before taxes, comfortably above the $61,432 the average retired household spends.
For many households, yes. At a 4.65% yield, $1 million produces about $46,500 a year. Add the roughly $49,704 a couple collects from average Social Security benefits and the household has around $96,000 before taxes, comfortably above the $61,432 the average retired household spends.
How much do I need to retire on $5,000 a month in dividends?
$60,000 a year requires about $1.29 million at a 4.65% yield, $1.5 million at 4%, or $1.71 million at 3.5%. If Social Security covers part of that $5,000, subtract it before dividing.
$60,000 a year requires about $1.29 million at a 4.65% yield, $1.5 million at 4%, or $1.71 million at 3.5%. If Social Security covers part of that $5,000, subtract it before dividing.
How much less do I need if I have Social Security?
Usually far less than people expect. The average retired worker receives about $24,852 a year and a couple who both claim receives roughly $49,704. Against average retiree spending, that leaves a gap of about $11,728, which a portfolio of roughly $293,000 covers at a 4% yield.
Usually far less than people expect. The average retired worker receives about $24,852 a year and a couple who both claim receives roughly $49,704. Against average retiree spending, that leaves a gap of about $11,728, which a portfolio of roughly $293,000 covers at a 4% yield.
Does the 4% rule still apply if I live off dividends?
Not in the same way. The 4% rule assumes you sell assets each year to fund spending. A dividend portfolio pays you without selling, so the relevant number is your portfolio yield rather than a withdrawal rate, and the risk you manage is a dividend cut rather than selling into a down market.
Not in the same way. The 4% rule assumes you sell assets each year to fund spending. A dividend portfolio pays you without selling, so the relevant number is your portfolio yield rather than a withdrawal rate, and the risk you manage is a dividend cut rather than selling into a down market.
How much do I need to retire on dividends at 55 or 60?
More than someone retiring at 67, because Social Security is not yet available and the portfolio has to cover the entire gap for several years. Retiring at 60 on $60,000 a year means funding the full amount until benefits start, so plan closer to the $1.29 million to $1.71 million range rather than the reduced figure a Social Security offset would allow.
More than someone retiring at 67, because Social Security is not yet available and the portfolio has to cover the entire gap for several years. Retiring at 60 on $60,000 a year means funding the full amount until benefits start, so plan closer to the $1.29 million to $1.71 million range rather than the reduced figure a Social Security offset would allow.
Concluding Thoughts on Portfolio Size and Retiring on Dividends
Retirement planning is complicated, so you may consider consulting a certified financial planner to help work out the best overall strategy for your long-term goals. But broadly speaking, while dividends can help bridge the $14,500+ annual income gap many retirees need, they are far from a cure-all for most investors given the upfront savings required.
A diversified portfolio of quality dividend growth stocks usually yields no more than 4% to 5% in today's market environment, which means that most investors still need a sufficiently large portfolio (about $300,000 or more) in order to retire on dividends and Social Security benefits.
A diversified portfolio of quality dividend growth stocks usually yields no more than 4% to 5% in today's market environment, which means that most investors still need a sufficiently large portfolio (about $300,000 or more) in order to retire on dividends and Social Security benefits.
It may be tempting to turn to higher-yielding sectors and industries such as REITs and BDCs to boost your portfolio's yield. Just remember that most such sectors have important tax implications to consider and can see sector-wide crashes when their business models are disrupted by infrequent but not impossible events, like the Financial Crisis.
Keep those issues in mind if you have the risk tolerance and desire to venture further out on the yield curve with part of your dividend portfolio, and never forget the importance of sound diversification.
Simply Safe Dividends does its best to recommend high-quality dividend growth stocks, with strong balance sheets, low-risk payouts, and proven track records of delivering dependable income in all economic, industry, and interest rate environments.
However, at the end of the day, while a quality dividend portfolio can be a solid path to a comfortable retirement, it's up to each individual household to ensure they have a large enough nest egg to generate sufficient supplemental income during their golden years.
Keep those issues in mind if you have the risk tolerance and desire to venture further out on the yield curve with part of your dividend portfolio, and never forget the importance of sound diversification.
Simply Safe Dividends does its best to recommend high-quality dividend growth stocks, with strong balance sheets, low-risk payouts, and proven track records of delivering dependable income in all economic, industry, and interest rate environments.
However, at the end of the day, while a quality dividend portfolio can be a solid path to a comfortable retirement, it's up to each individual household to ensure they have a large enough nest egg to generate sufficient supplemental income during their golden years.