A Guide to Investing in Business Development Companies (BDCs)
Business development companies (BDCs) sport high dividend yields but come with several important nuances income investors need to understand.
Let's take a look at why these specialty finance stocks offer such large payouts, review the metrics that matter, and discuss the key risks dividend investors need to be comfortable with.
What is a BDC?
BDCs trace their origin to the 1980 Small Business Incentive Act, which amended the 1940 Investment Company Act; itself an answer to the 1929 stock market crash that heralded the Great Depression.
While the Investment Company Act resulted in much needed changes to the transparency of investment firms, the rise of BDCs was because Congress recognized the need for private capital to raise funds more easily from regular investors in order to serve the vast middle market loan market.
The middle market loan market consists of about 200,000 private businesses in the U.S. that make up roughly one-third of GDP. These are generally small companies with more speculative credit profiles, so large banks are less likely to lend them capital.
The 2007-09 financial crisis reinforced this dynamic, thanks to the passage of stricter banking regulations such as Dodd-Frank and Basell III.
These laws require banks to hold more, higher quality assets on their balance sheets to ensure that another economic downturn or financial crisis won’t threaten the global financial system. BDCs help fill the gap by providing debt and equity financing to middle market companies.
A BDC is technically a regulated investment company (RIC), which is a closed-end investment fund (meaning investors can’t withdraw money from the fund like they can a mutual fund) structured similarly to a real estate investment trust (REIT).
Specifically, the BDC can avoid paying corporate taxes if it distributes at least 90% of taxable income in the form of dividends. Due to this requirement, BDCs retain very little earnings and require raising external capital from debt and equity markets in order to grow.
In addition, thanks to their beneficial tax status, BDCs are limited by law to holding at least 70% of assets in private U.S. companies. Their debt-to-equity ratio (leverage) is also limited to 2.0, meaning $2 in debt for every $1 in equity.
Types of Business Development Companies
BDCs come in many different varieties, including which industries they specialize in, as well as the types of loans they make.
For example, Hercules Technology Growth Capital (HTGC) specializes in technology companies, while PennantPark Floating Rate Capital (PFLT) deals exclusively in floating rate loans, which rise when interest rates do.
However, one of the most important distinction that a potential BDC investor must make is between internally and externally managed BDCs.
Externally managed BDCs have higher cost structures because the management team doesn’t actually work for the company.
Rather, management is provided by an external financial company, one that usually specializes in large scale mid-market lending and is paid a hybrid fee structure consisting of a base rate (usually 1-2% of gross assets) and a performance fee. The performance fee is usually 20% of net asset value (NAV) growth above a predetermined fixed hurdle rate.
In addition to a higher cost structure, there are two main downsides of externally managed BDCs.
First, management doesn’t actually have to disclose its compensation information. For example, John F. Barry III, CEO of Prospect Capital Management, the manager of BDC Prospect Capital Corporation (PSEC), was reported by insiders to be making as much as $100 million annually, or over 30% of total revenue some years.
This leads to the second potential risk with externally managed BDCs: potential conflicts of interest. Specifically, management can guarantee itself a higher payday as long as it grows gross assets, which can be defined in a variety of ways.
For example, Prospect Capital (which is an example of BDCs to avoid) historically included debt and cash that’s not yet invested in its asset calculations. In other words, management can sell as many new shares as it wants, as well as take on extra debt, to grow its fees, even if the resulting shareholder dilution destroys investor value over time.
Prospect did this for years, with the resulting shareholder dilution and excessive management fees resulting in declining shareholder value (NAV) and a series of dividend cuts that have caused shares to decline over time.
Simply put, Prospect, as well as some other externally managed BDCs, can be run more like a publicly traded hedge fund, for the enrichment of management first, and investors second.
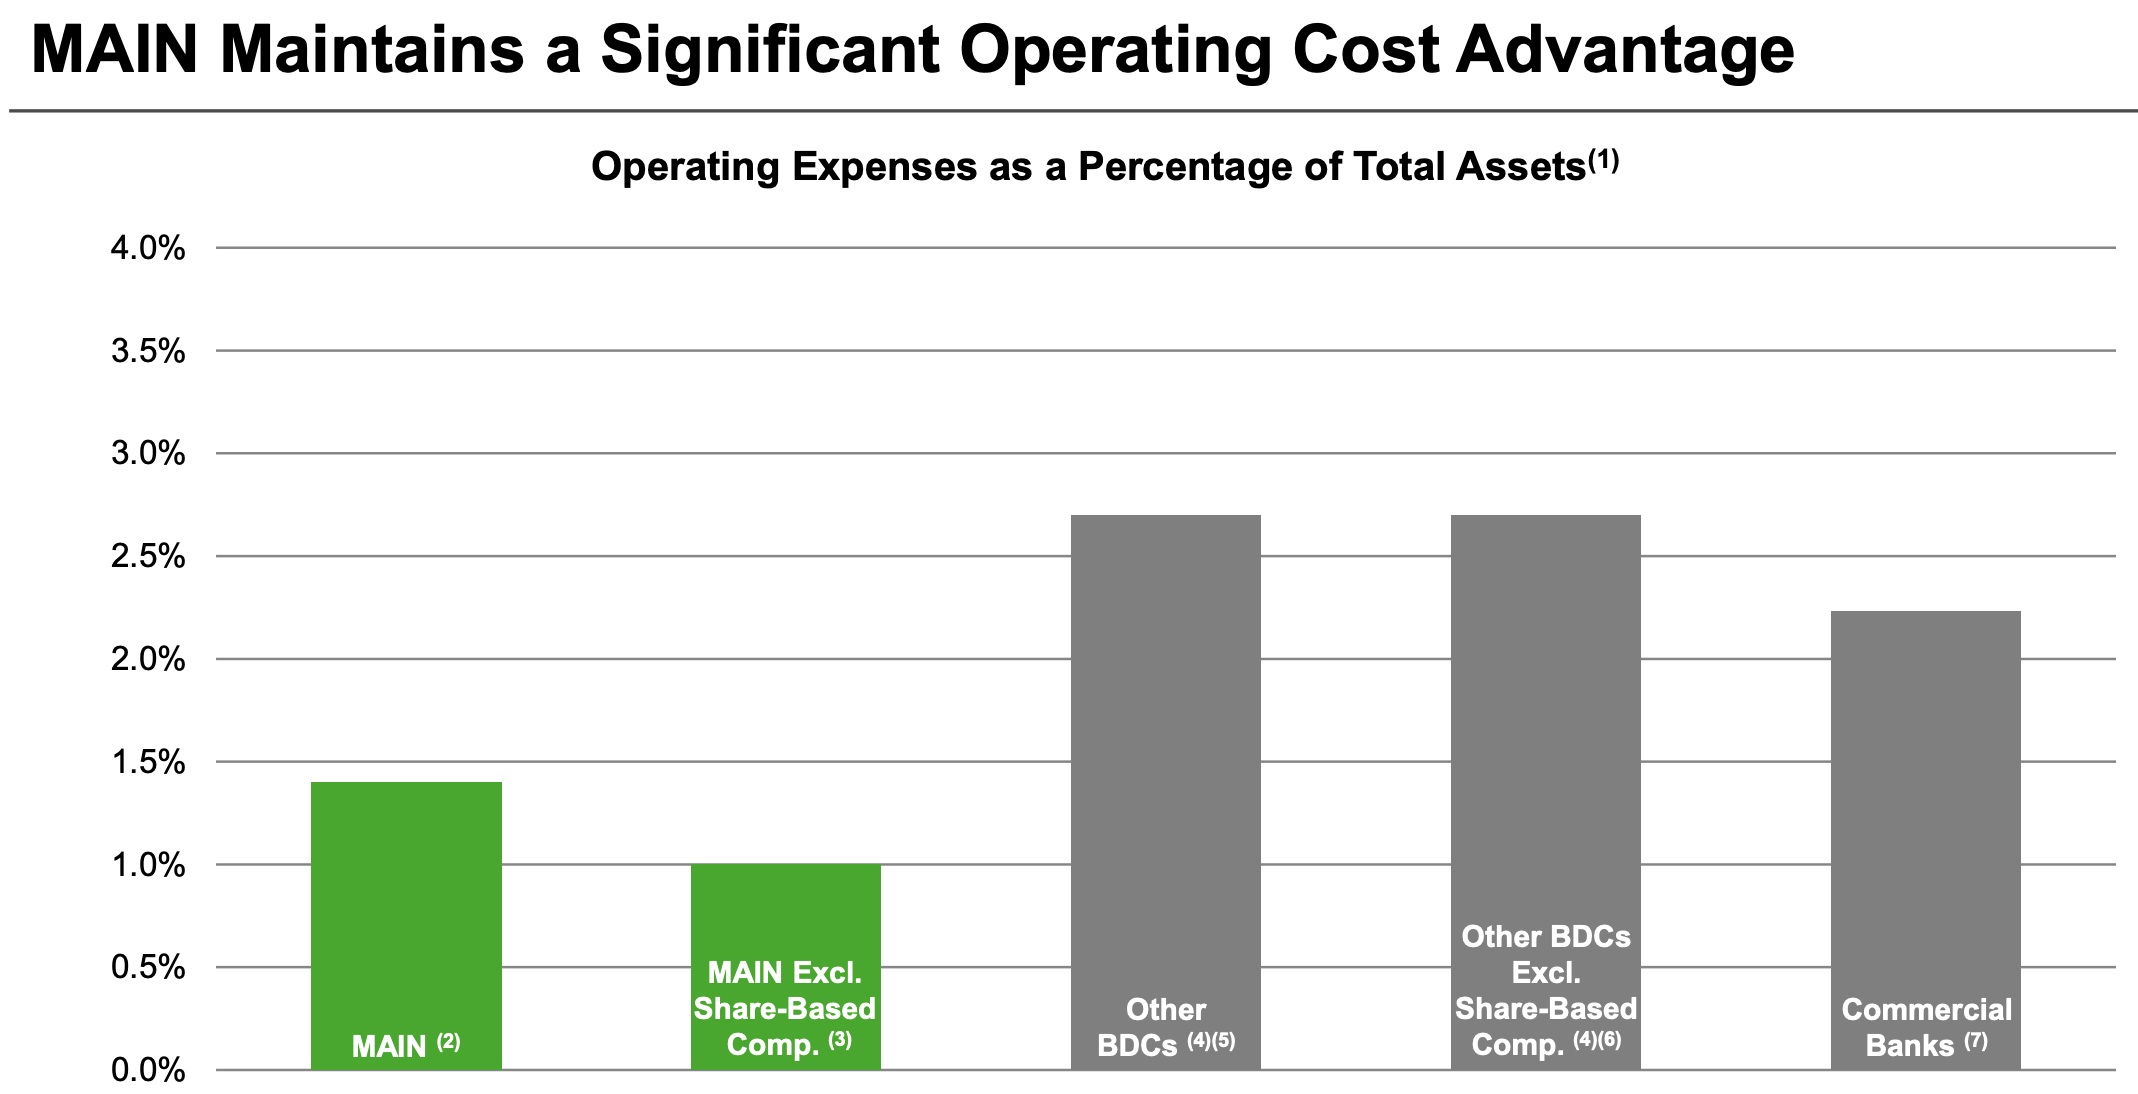
In contrast, internally managed BDCs such as Main Street Capital (MAIN) generally have lower costs due to a lack of external management fees, as well as compensation incentives that are better aligned with shareholders because they are usually based on growth in NAV per share.
Source: Main Street Capital Investor Presentation
This means that management can’t get a raise unless it is consistently creating shareholder value. And since internally managed BDCs don’t pay their executives as a percentage of assets, internally managed BDCs can achieve better economies of scale as they grow.
The end result is that earnings per share grow, making the dividend more secure and capable of better long-term growth.
That said, there are several good reasons that one might choose to own an externally managed BDC.
For example, take a look at one of the largest BDCs, Ares Capital Corp (ARCC). Ares Capital is managed by Ares Capital Management, one of the world’s largest alternative investment managers.
This scale gives Ares Capital access to potential customers and deals that smaller, internally managed BDCs without major sponsors couldn’t do. In addition, not all externally managed BDCs are run by poorly incentivized management teams.
Some have much lower base management fees of just 1% and exclude things like cash and credit revolvers from their gross asset calculations.
To find higher quality BDCs, let's take a look at the industry's key risks and important metrics.
Big Yield Means Big Risks
Despite interest rates remaining near historic lows, many BDCs sport dividend yields near 10% or higher. As you might suspect, the industry's high yields come with a lot of risk in most cases.
The cash flow supporting dividends paid by BDCs usually consists of high interest loans to companies that other banks won’t touch. In other words, these are higher risk, subprime borrowers who have no better alternative for financing their businesses.
However, that doesn’t mean all BDC loans are created equal. Just like with bonds, there are different types of loans, of varying quality, with higher risk generally corresponding with higher interest rates.
BDCs with higher costs (usually the externally managed ones, like Prospect Capital) have to reach more for yield in order to cover their dividends. This means lending to riskier, often distressed companies, including in tough industries such as oil and gas.
In addition, some of these loans are riskier than others because they are unsecured, meaning no collateral backs them up. In the event that the company defaults on its loan, the BDC can end up taking a big loss, which shows up as a decline in NAV per share, similar to the book value per share of a bank.
Since share price generally tracks NAV per share over time, a decline in NAV caused by defaults and loan write-offs means a lower share price and a harder time for the company to raise equity capital at high enough prices (i.e. a low enough cost of equity) to grow NAV per share over time.
Since BDCs depend on issuing equity to raise most of their investment capital, they are also at the mercy of fickle investor sentiment.
If share prices fall too low because management made too many speculative loans that are now defaulting, the share price can fall low enough to trap the BDC in a downward spiral of declining NAV, ongoing dividend cuts, and a slumping share price that destroys investor capital.
Another problem is the industry's low barriers to entry. In today’s world, which is awash in cheap capital, anyone can set up a BDC and compete for customers.
With interest rates staying low for so long, net interest margins, or the difference between the cost of borrowing and the interest rate at which BDCs can make loans, has steadily declined.
This has made the higher cost BDCs more desperate to reach out further on the risk curve with their loan books. When economic conditions or specific industries get hit hard, this can result in higher default rates.
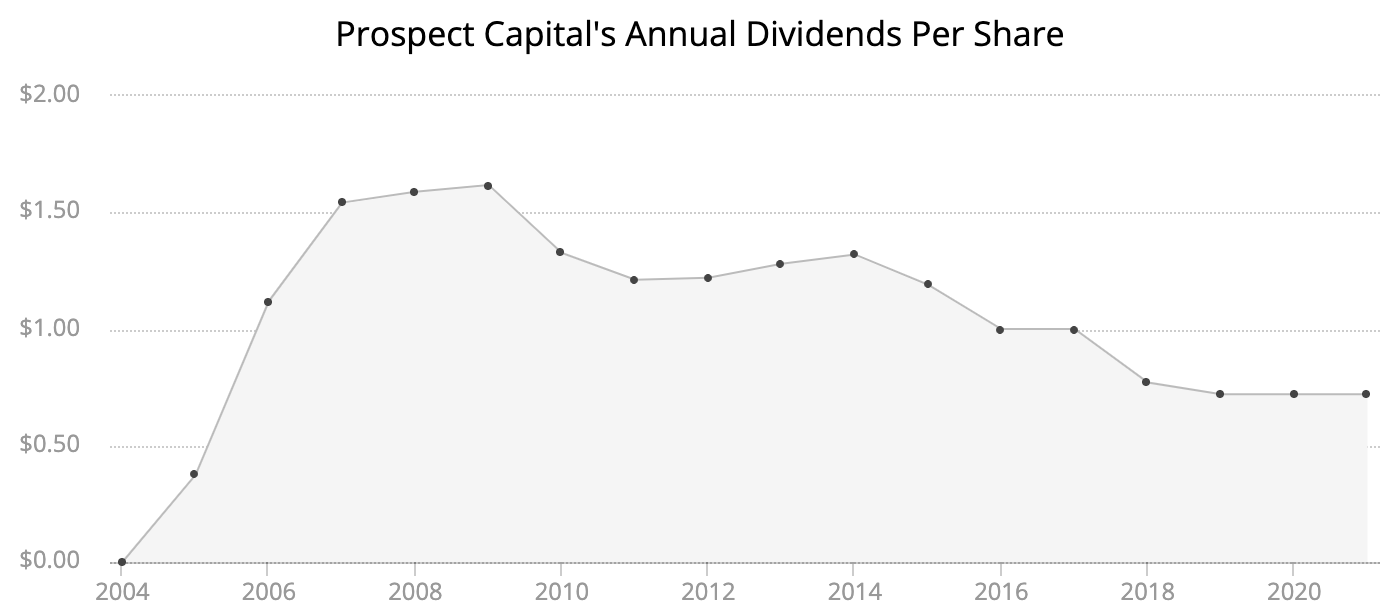
As this chart of Prospect Capital’s dividend shows, the BDC industry, like banking, is cyclical, tracking economic health. No one can forecast macro conditions with any real consistency, but downturns are not good for BDCs.
Source: Simply Safe Dividends
Unfortunately, many BDCs went public after the financial crisis, thanks to zero interest rates making their high-yields more attractive.
As a result, investors seeking a track record that spans various economic and interest rate conditions don’t have many options, other than a few like Main Street Capital and Ares Capital Corp.
With few BDCs sporting long-term dividend track records to evaluate, investors must focus on other gauges of quality to separate strong BDCs such as Main Street Capital from potential value traps like Prospect Capital.
How to Choose Quality BDCs
BDCs have four key metrics that investors should understand: weighted average portfolio yield, NAV per share, the non-accrual ratio, and the NII payout ratio.
Portfolio yield is the weighted average yield on the BDC's loans and other assets (which can include equity stakes in the companies they finance). The weighted average portfolio yield can reveal two important things about a BDC.
First, the yield can be a good proxy for risk profile of a BDC's loan portfolio. Since these are subprime loans, a lower yield is generally better because it suggests the loan book is likely weighted more towards first-lien (i.e. more senior) debt.
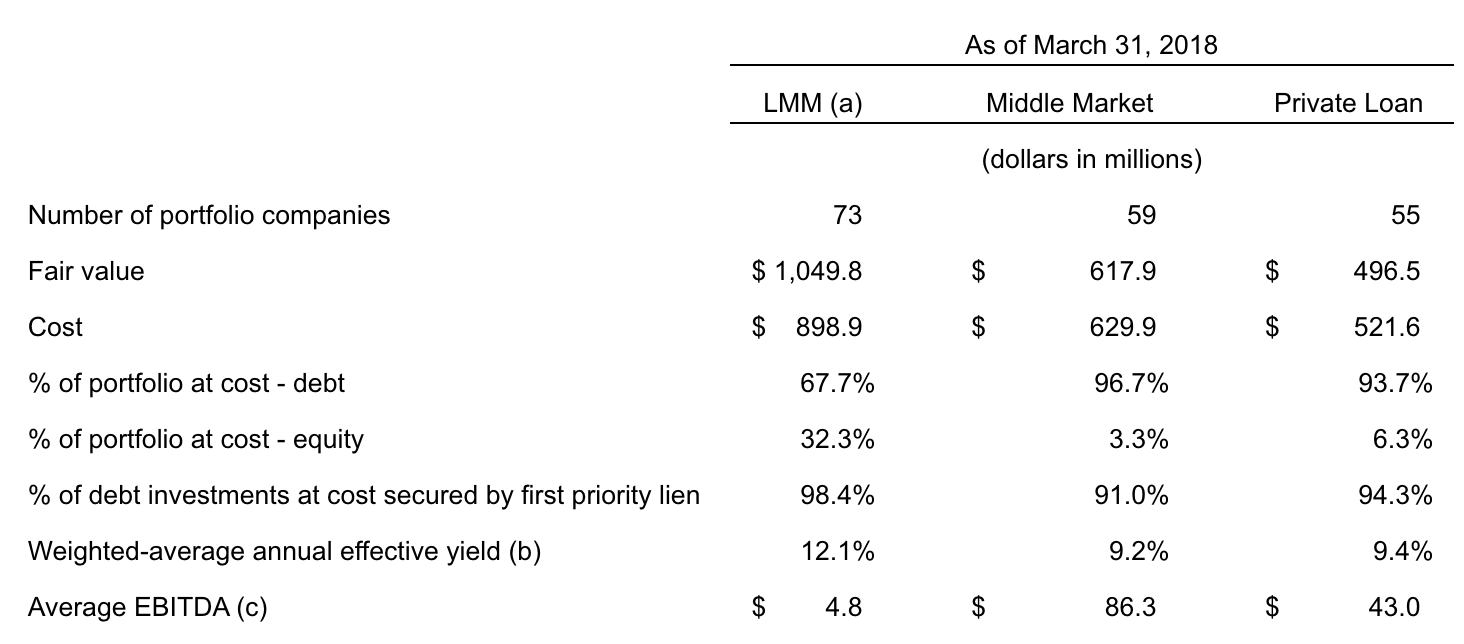
In the event of a default, that allows the BDC to recoup at least some of its investment. Using an example from Main Street Capital's Q1 2018 results below, we can see two important facts.
First, the firm's loan book was conservative by the standards of the industry, where average portfolio yields can often be 13% to 15% (Main Street Capital’s yield was around 10.5%).
Second, the portfolio yield was above the stock's dividend yield near 6%. This tells us that Main Street’s portfolio could support the monthly regular dividend management pays, assuming interest payments continue to be made.
Another metric investors should check with any BDC is the trend in NAV per share. Remember that financial companies like BDCs and banks have an intrinsic value, which is the total value of all tangible assets minus liabilities.
But since BDCs have rising share counts, thanks to a constant influx of new equity capital, we need to make sure that NAV or shareholder value per share is rising over time. This is the best way of telling whether a BDC is helmed by a skilled management team that can be trusted with your capital (and is not growing for the sake of growth).
Growth in NAV per share is usually rather slow. However, demanding a positive growth rate is one of the better filters for excluding BDCs whose management teams have proven incapable of creating long-term shareholder value.
Another reason that NAV per share is an important metric is because the premium or discount a BDC trades at (Price-to-NAV) is another proxy for the quality of the management team. A BDC's price-to-NAV multiple generally ranges from 0.5 to 1.75.
This metric matters for two reasons. First, a BDC that can’t invest accretively (i.e. increasing its NAV per share), either due to a poor management team, high cost structure, or both, will destroy shareholder value by decreasing NAV per share over time. The market thus tends to price the highest quality, most successful BDCs at a premium to NAV per Share.
While that may seem counterintuitive, to invest in BDCs that are trading at or above NAV per share (above 1.0), it can actually be the conservative approach to this high-risk industry.
For example, take Full Circle Capital, which destroyed over 50% of NAV per share (i.e. shareholder value) from 2011 through 2015. The firm's stock lost 11.9% per year while the market gained 12.4% annually over this period.
The market was offering Full Circle at a steep 25% discount to its intrinsic value (a price-to-NAV ratio of 0.75). But if you had realized that Full Circle had a history of growing through excessive shareholder dilution, resulting in a collapsing NAV per share, a 50%-plus reduction in the dividend since 2011, and a large loss over that time, you would have avoided investing in this low-quality BDC.
On the flip side, Main Street Capital trades at a premium to NAV per share as investors price in the best management team in the industry, one of the least risky loan books, and one of the most secure dividends.
While past success is no guarantee of future excellence, in the high-risk BDC industry it can be a helpful factor to evaluate. In addition, a premium valuation can actually help “winners keep winning".
BDCs are constantly selling equity to grow their assets, because they are legally limited to a debt-to-equity ratio of 2:1. If a BDC is trading below its NAV per share, then every share sold destroys shareholder value because, as we saw with our Full Circle Capital example, it is selling $1 in assets for $0.75.
On the other hand, Main Street’s premier “brand” in the BDC industry has allowed it to sell new shares to raise growth capital at the rate of about $0.60 in assets per share for each $1 in additional equity raised. That extra $0.40 per share benefits existing investors because it is accretive to NAV per share.
In other words, Main Street's solid reputation helps it to secure low costs of equity capital and keep growing its asset base, net investment income per share, and dividend. That, in turn, leads to more earnings and a more secure dividend, which in the long-term causes the share price to appreciate.
The next metric that’s important for BDC investors to keep track of is the non-accruing loan ratio, which tells you how much of a company’s loans are in default.
For the first quarter of 2018, Main Street had six loans on non-accrual status representing 0.8% of its total investment portfolio at fair value. This is a healthy level that should not put the dividend at risk.
However, BDC investors should monitor a firm's non-accrual ratio because changes can signal that the credit market may be turning, a potential prelude to a recession and trouble for the industry as a whole.
Finally, a BDC's net investment income (NII) is what funds the dividend. NII represents a BDC's total investment income reduced by operating expenses such as financing costs and management fees.
Since BDCs are legally required to pay out almost all income as dividends, most will maintain payout ratios above 90%. This slim margin of safety can put dividends at risk during downturns when loan losses mount.
To mitigate this risk, the best BDCs like Main Street will retain a portion of gains realized upon the exit of successful investments. These funds (known as "spillover") provide an offset against credit losses, providing additional support for the dividend until the economy recovers.
BDCs and Taxes: What You Need to Know
BDCs are essentially investment funds that generate qualified dividends, non-qualified dividends, and sometimes returns of capital (giving shareholders their money back). Every dividend will have a certain percentage of each kind of income.
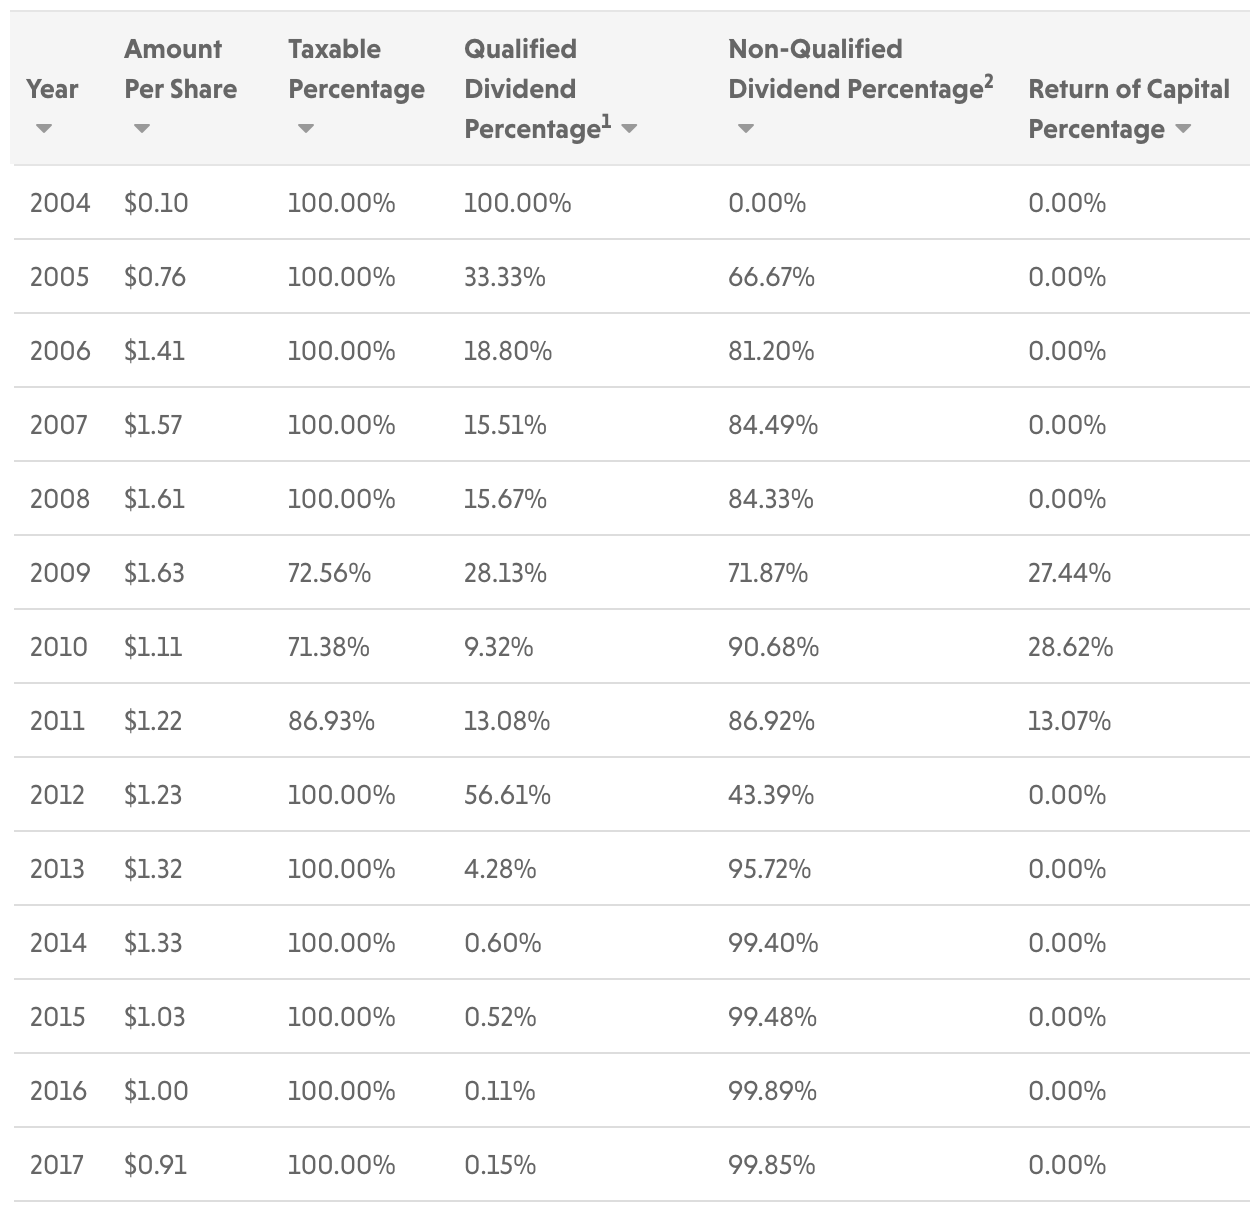
The company reports the actual breakdown after the end of its fiscal year and sends it to investors in a 1099 form. Here’s a look at how Main Street Capital’s dividend payments were classified in 2017:
Source: Main Street Capital
Prospect Capital provides another example here:
Source: Prospect Capital
While the individual makeup of each BDC will vary and can change substantially from year to year, generally the largest percentage of the dividend is taxed as non-qualified ordinary income.
This is because Congress created BDCs to help fund small business growth and structured them as pass-through entities, similar to REITs, which also pay non-qualified dividends.
The reason that some BDCs, such as Main Street Capital, have relatively high qualified proportions of their dividends is due to their larger equity stakes in the companies they finance, which generate qualified dividends and long-term capital gains.
The importance of qualified versus non-qualified dividends is that qualified dividends are taxed at either 0%, 15%, or 20% depending on your tax bracket, while non-qualified dividends are taxed at your top marginal income tax rate (up to 37%).
As such, BDCs are generally best owned in tax-advantaged accounts such as IRAs and 401(k)s.
Closing Thoughts on BDCs
Most BDCs are not for conservative income investors seeking steady dividends. These businesses are complex, volatile, and, much like banks, own hard-to-decipher “black boxes” of various loans and financial assets that many investors simply don’t wish to bother with.
That said, as long as you understand what they are, the risks involved, and how to identify quality BDCs, select BDCs can make a reasonable contribution as part of a well-diversified dividend portfolio in search of yield.