Top 10 Financial Ratios for Successful Dividend Investing
Dividend investing is part art, part science. Financial ratios make up most of the science.
We define financial ratios as any number or calculation used by dividend investors to better understand an investment opportunity.
Financial ratios are found throughout a company’s financial statements, annual reports, investor presentations, and more. Examples of common financial metrics include return on equity, payout ratios, and price-to-earnings multiples.
While hundreds (if not thousands) of financial ratios exist, understanding the most important indicators can help investors make better informed decisions, identify great companies, and sidestep avoidable mistakes.
“Accounting is the language of business, and you have to learn it like a language… To be successful at business, you have to understand the underlying financial values of the business.”
–Warren Buffett
All of the financial ratios discussed below are available in up-to-date charts and tables on Simply Safe Dividends, which provides a complete suite of tools and research for dividend investors.
Let’s review the most helpful financial ratios for evaluating different businesses and identifying quality stocks that can deliver safe, growing dividends.
Financial Ratio #1: Dividend Payout Ratio
The dividend payout ratio is one of the most common financial ratios known by income investors. The payout ratio measures how much of a company’s earnings are paid out as a dividend.
To calculate a company’s dividend payout ratio, simply divide the amount of dividends it paid over a certain time period by the amount of earnings it generated.
For example, if Coca-Cola paid $6 per share in dividends while generating $10 per share in earnings, it would have a payout ratio of 60% ($6 / $10 = 60%).
Investors like to analyze the dividend payout ratio because it can inform how safe a company’s dividend is and how much room it has for future growth.
A high payout ratio (e.g. above 80%) could mean that the dividend payment is riskier because it consumes the majority of a company’s earnings. If business trends unexpectedly fall, there might not be enough profits to keep paying the dividend.
Dividend growth can also be more difficult for companies with high dividend payout ratios unless earnings growth is strong.
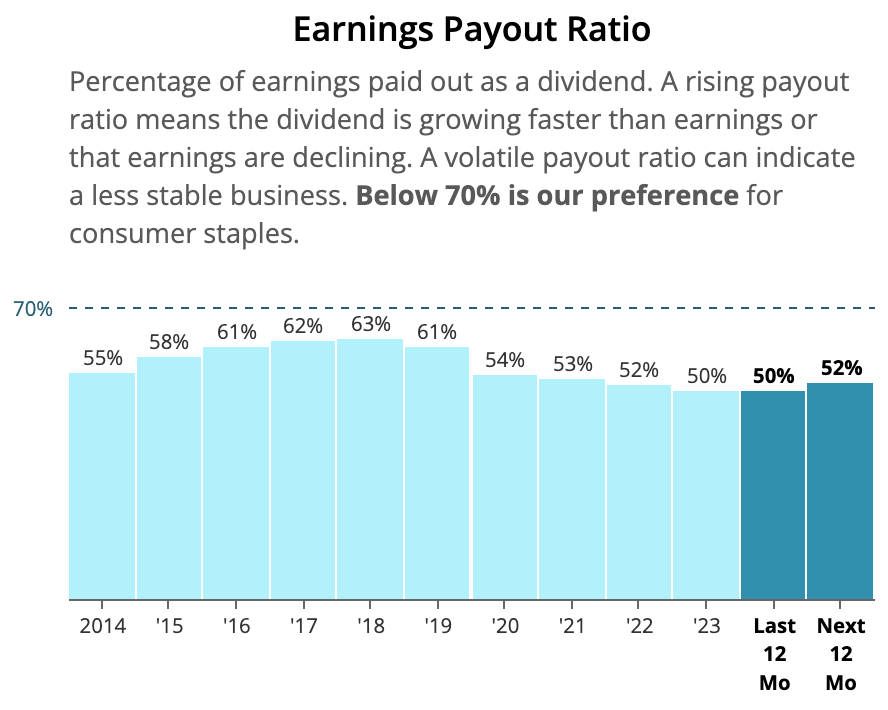
Generally speaking, we prefer to invest in companies with payout ratios below 60%. However, we will invest in companies with higher payout ratios if their businesses tend to be very stable (e.g. a regulated utility business) and they maintain strong financial health.
General Mills' dividend payout ratio below is an example of what we like to see. Note how stable the firm's payout ratio has been, reflecting predictable earnings from selling packaged foods and management's disciplined dividend growth (around 4-5% per year over this period).
Source: Simply Safe Dividends
Financial Ratio #2: Free Cash Flow
Without free cash flow, a company is unlikely to survive over the long run.
Free cash flow is calculated using the company’s statement of cash flows. A company’s capital expenditures (i.e. money spent on property, plant, and equipment) are subtracted from its cash flow from operations (i.e. net income adjusted for non-cash charges such as depreciation) to arrive at free cash flow.
If a company does not generate free cash flow, it does not have funds to return to shareholders via dividends and share repurchases, nor does it have sustainable cash flow to use for acquisitions or debt repayments.
Companies that fail to generate free cash flow typically have capital-intensive businesses with few competitive advantages. We prefer to invest in companies that consistently generate free cash flow in most environments.
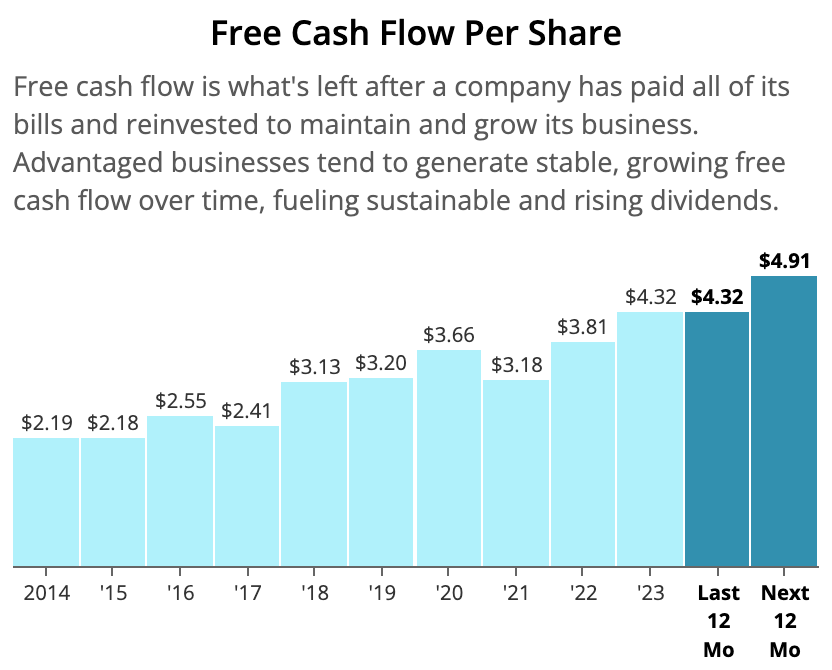
Paychex is one such business. The company provides a variety of payroll processing and HR outsourcing services to small and medium-sized businesses. Its operations require little capital and enjoy high recurring revenue, resulting in consistent free cash flow generation.
Source: Simply Safe Dividends
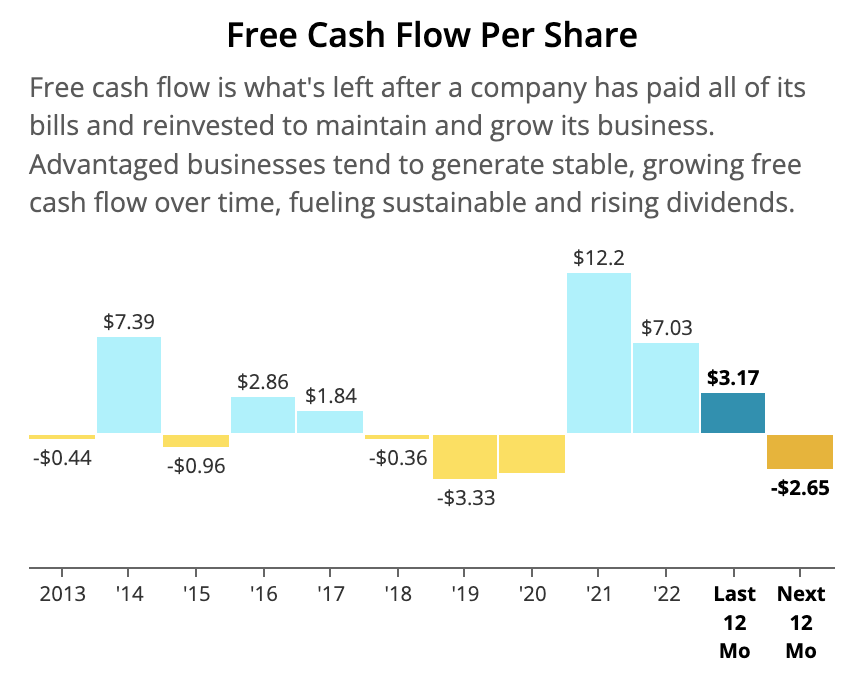
On the other end of the spectrum, U.S. Steel has been an unpredictable free cash flow generator. The company must invest heavily in its capital-intensive steel mills and has little control over the prices it can charge for its products.
Source: Simply Safe Dividends
Looking at free cash flow generation alone, Paychex is much better positioned to be a reliable dividend growth stock.
Financial Ratio #3: Return on Invested Capital
Suppose you had $100 to invest. One company can turn your $100 into $105, but another company can produce $110 with your money. All other things equal, we would pick the second company because it can grow our money faster.
To keep things simple, that is what return on invested capital is all about. Businesses take in funds (debt and/or equity) and invest to generate a return for shareholders.
Companies that earn higher returns can compound our capital faster and are generally more desirable. Companies that earn returns below what investors demand should, in theory, eventually go out of existence.
For these reasons, one of Warren Buffett’s favorite financial ratios is return on equity, which divides a company’s net income by its shareholders’ equity.
For example, if shareholders bought $100 of stock to fund a company and it generated $10 of profit, the company’s return on equity would be 10% ($10 of net income divided by $100 of equity).
Buffett likes companies that earn a high return on equity because they compound earnings faster and usually have some sort of competitive advantage.
"The ideal business is one that earns very high returns on capital and that keeps using lots of capital at those high returns. That becomes a compounding machine."
– Warren Buffett
Return on invested capital is similar to return on equity, but it measures a company’s return on equity and debt. This is a key adjustment because it helps adjust for differences in capital structures between firms so we can better compare them.
For example, suppose there were two companies that each had $100 worth of assets. Company ABC financed its assets all with equity ($100). Company XYZ financed its assets with $20 of equity and $80 of debt. Both companies generated $10 per share in earnings last year.
If we were simply looking at return on equity, Company ABC would have a return of 10% ($10 of earnings divided by $100 of equity). However, Company XYZ would have a return on equity of 50% ($10 of earnings divided by $20 of equity).
At first glance, Company XYZ would seem like the superior business despite their identical level of assets and earnings.
Using return on invested capital instead, we would find that both companies generated a 10% return ($10 of earnings divided by $100 of total capital).
When we analyze a company’s return on invested capital, we look at the level (e.g. 10%) and consistency of its returns (e.g. does it earn a stable return each year or are the returns very volatile).
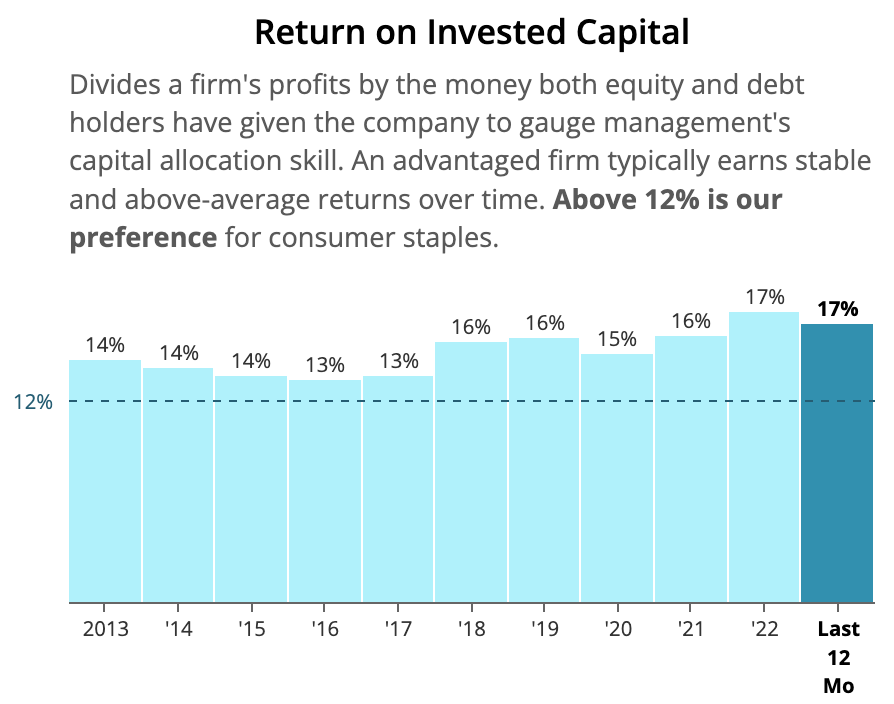
A stable, double-digit return on invested capital over many years of time is often the sign of a highly profitable, efficient company that could have an economic moat.
An example would be Coca-Cola (KO), one of Warren Buffett’s largest holdings. The company has earned a return on invested capital between 13% and 17% in each of the last 10 years.
Source: Simply Safe Dividends
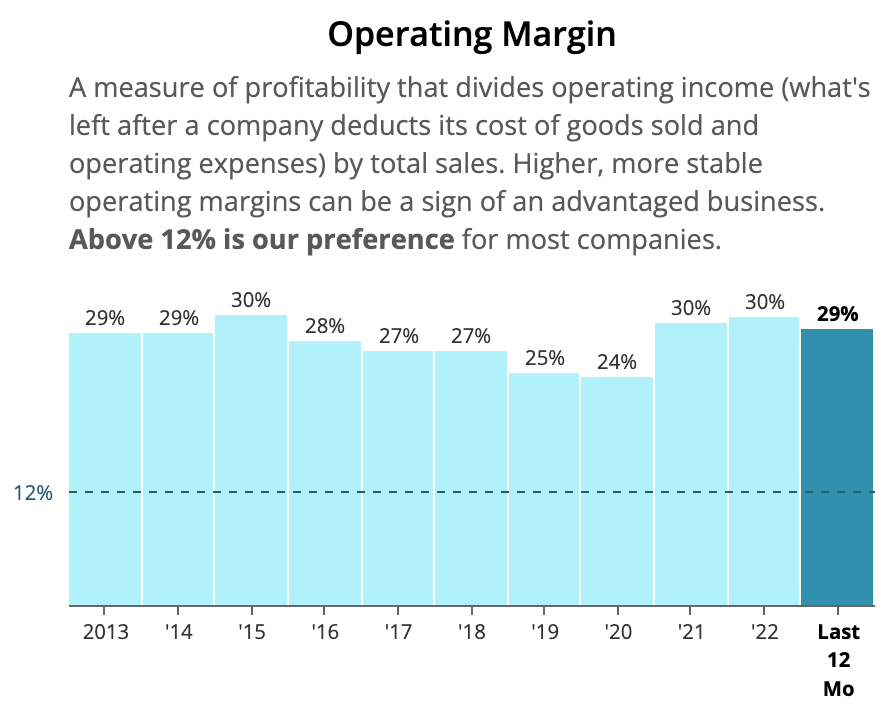
Financial Ratio #4: Operating Margin
A company’s operating profit margin divides its operating profits by its total sales. Operating profits generally represent the company’s earnings before interest and taxes.
By excluding these expenses, we can compare companies regardless of their financing choices (debt results in interest expenses) and tax treatments to focus on the profitability of their actual operations. Higher operating profit margins can be a sign that a company has an economic moat.
Just like with our analysis of a company’s return on invested capital, we pay close attention to the level and consistency of a company’s operating margin. High and stable margins are preferable because they help earnings compound faster.
Another Warren Buffett favorite, Apple, has consistently reported operating margins of around 25% to 30%, reflecting the firm's pricing power and high mix of lucrative digital services revenue.
Source: Simply Safe Dividends
Financial Ratio #5: Sales Growth
Sales growth compares the change in revenue between two periods and is expressed as a percentage. For example, if sales increased from $100 in 2022 to $120 in 2023, sales growth would be 20% ([$120 – $100] / $100).
Trends in sales growth can inform us about the volatility of a company’s business model and its ability to continue expanding.
Let’s take a look at Caterpillar as an example. As seen below, the heavy equipment maker's sales have plunged by double-digits multiples times over the past decade. When the economy slows, demand for big-ticket machinery falls fast.
If an investor is considering buying a company with cyclical growth trends, they need to be sure they are not picking it up near peak demand – buying a cyclical at the top of a cycle is one of the easiest ways to lose a lot of money quickly.
Source: Simply Safe Dividends
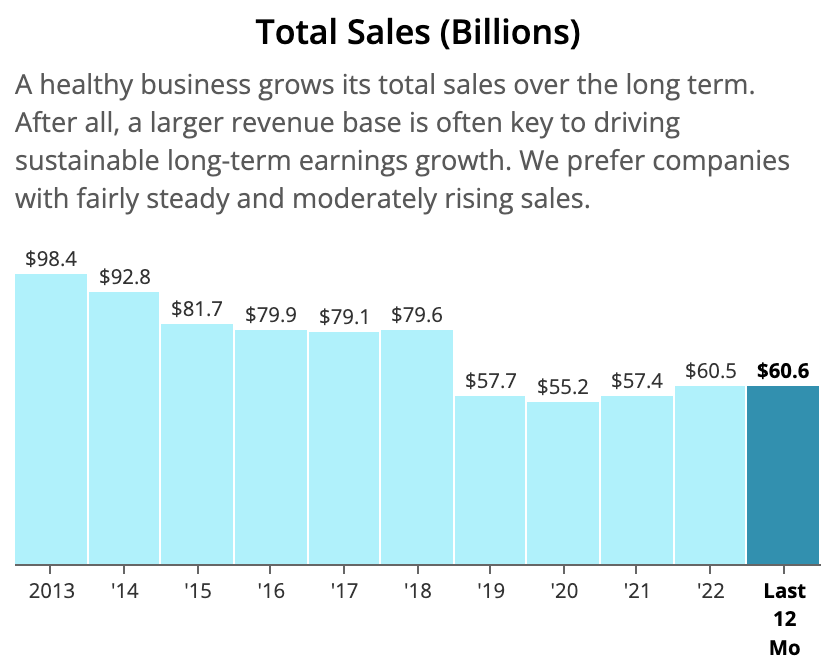
The long-term trend in sales can tell a story, too. International Business Machines (IBM) has struggled for years to deliver profitable growth as customers have migrated to the could, creating secular growth pressure for Big Blue's on-premises businesses.
Source: Simply Safe Dividends
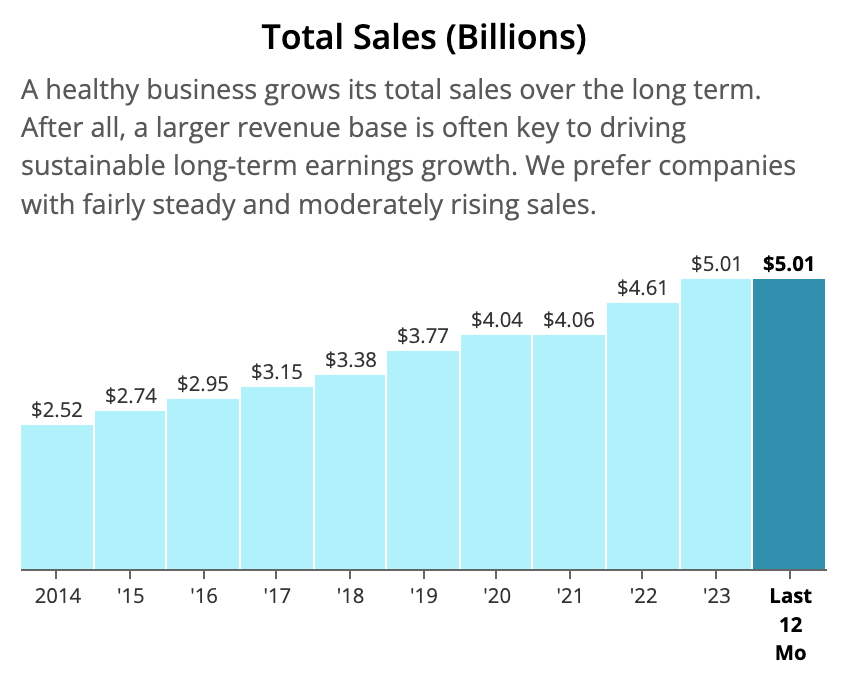
On the other hand, Paychex has delivered clockwork-like revenue growth. The company's high mix of recurring revenue, essential services, and growing addressable market make it easier to expand.
Source: Simply Safe Dividends
We prefer to own businesses that sell timeless products and services with stable demand and leadership positions in large and growing markets. These companies often have more within their control and clearer paths to becoming more profitable enterprises in the long run.
Financial Ratio #6: Net Debt to Capital
Financial leverage can be dangerous:
"My partner Charlie says there is only three ways a smart person can go broke: liquor, ladies, and leverage. Now the truth is, the first two he just added because they started with 'L' – It’s leverage."
– Warren Buffett
A company's net debt to capital ratio reveals how much debt (net of cash on hand) a firm is using to run its business.
If a company has $100 worth of equipment, it acquired that equipment through some combination of debt and equity.
The net debt to capital ratio tells you what proportion of a company’s financing is from debt. Using the example above, suppose the $100 of equipment was supported by $20 of debt and $80 of equity.
The company’s debt to capital ratio would be calculated as follows: total book debt ($20) divided by total book debt ($20) plus equity ($80). The result is a debt-to-capital ratio of 20% ($20 / $100). In other words, debt accounts for 20% of the company’s capital structure.
We prefer to invest in companies with a net debt to capital ratio no higher than 50%, although some businesses such as utilities can reasonably take on higher debt levels due to the reliability of their earnings.
If a company unexpectedly falls on hard times and has too much debt and interest to pay with its dwindling cash flow, its stock price can get crushed and the dividend payment becomes that much riskier. Companies will always pay their debt obligations before paying a dividend.
Financial Ratio #7: Net Debt to EBITDA
While the debt to capital ratio focuses on a company’s capital structure, the net debt to EBITDA ratio compares a company’s debt to its earnings.
The idea behind this financial ratio is that a company with a seemingly high level of debt might not be as risky as it appears if it is generating a lot of profits and has plenty of cash on hand.
Net debt is a company’s total debt less the cash it has on hand. For example, if a company had $100 of debt and $10 of cash, its net debt would be $90.
EBITDA stands for “earnings before interest, taxes, depreciation, and amortization” and is meant to be a proxy for cash flow, although it does not account for a company's borrowing costs and capital expenditures to maintain its business.
Despite these important drawbacks, EBITDA is a helpful metric for comparing different businesses. EBITDA is typically measured over the course of one year.
Dividing net debt by EBITDA, we can calculate how many years it would take a business to pay off its debt using its cash on hand and annual cash flow (again, excluding interest costs, taxes, and maintenance capital expenditures).
Suppose Pepsi had $100 of debt, $10 of cash on hand, and $45 of EBITDA last year.
Pepsi’s net debt would be $90 ($100 of debt less $10 of cash). Dividing net debt ($90) by Pepsi’s EBITDA ($45) gives us a net debt / EBITDA ratio of 2.0.
In other words, Pepsi could theoretically eliminate its debt with cash on hand and two years’ worth of cash flow.
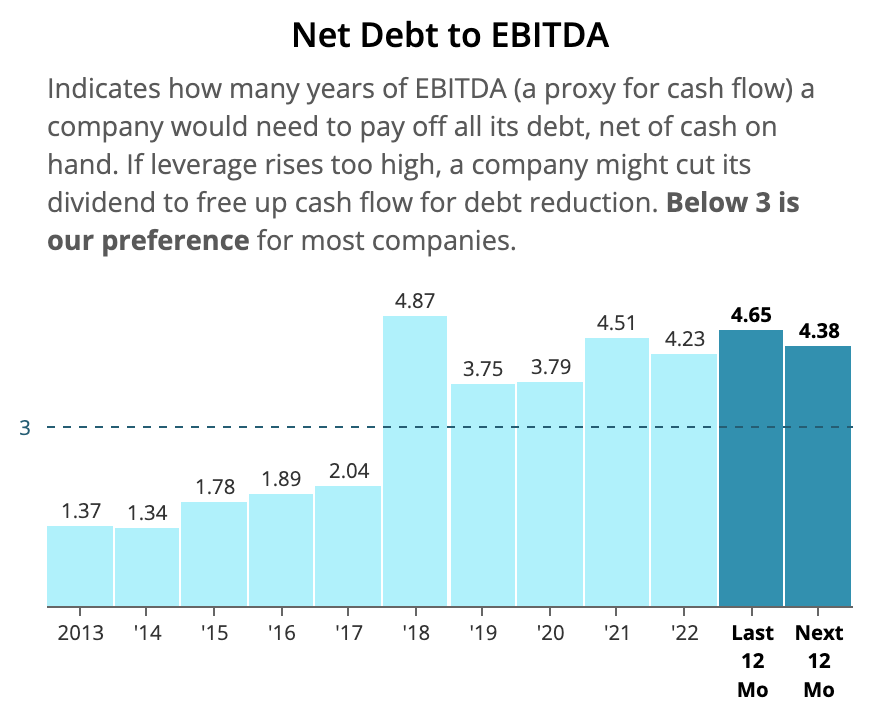
We generally prefer to invest in companies with a net debt / EBITDA ratio no greater than about 3.0, but companies with more stable earnings can afford somewhat higher leverage ratios.
Paying attention to trends in leverage also provides insights. In the example below, we can see debt has significantly increased over time to reach elevated levels. Conservative investors might want to pass on a business in this position until the balance sheet strengthens.
Source: Simply Safe Dividends
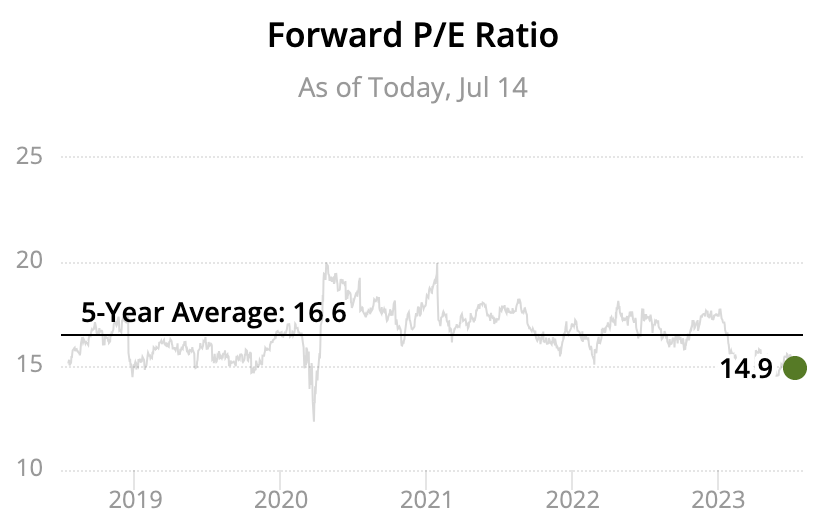
Financial Ratio #8: Price-to-Earnings Ratio
The price-to-earnings (P/E) ratio is arguably the most popular valuation metric used by investors.
The metric divides a company’s stock price by the amount of earnings per share it has generated over a one-year period.
Historically speaking, the average P/E multiple for the market has been about 15. Stocks perceived to have more stable earnings and faster earnings growth potential usually trade at higher earnings multiples than the market.
For mature companies with stable long-term outlooks, we like to compare their current P/E ratios with their long-term averages. This can reduce the risk of overpaying if you avoid buying shares when the stock's multiple trades well above its typical range.
The chart below plots this data for Johnson & Johnson. Assuming nothing has changed with the company's future prospects, it could be a reasonable time to buy the stock with its P/E ratio of 14.9 sitting near the bottom of its 5-year range.
Source: Simply Safe Dividends
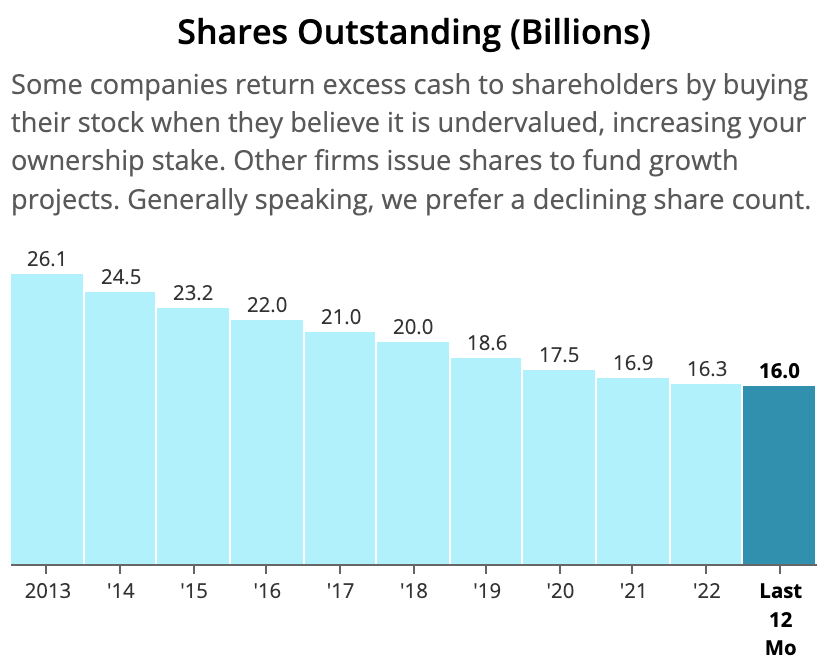
Financial Ratio #9: Shares Outstanding
Companies that need a lot of cash issue shares (and/or debt). Companies that generate more cash than they know what to do with can buy back their shares (and/or pay dividends).
The long-term trend in shares outstanding can tell you which type of company you are dealing with. Here's a look at Apple's impressive chart:
Source: Simply Safe Dividends
We generally like businesses that reduce their shares outstanding over time. This increases our ownership stake without requiring us to put in more capital. And it happens tax-free.
Buybacks can create meaningful shareholder value when they take place at attractive prices, but that doesn't always happen.
"The math isn't complicated: When the share count goes down, your interest in our many businesses goes up. Every small bit helps if repurchases are made at value-accretive prices. Just as surely, when a company overpays for repurchases, the continuing shareholders lose. At such times, gains flow only to the selling shareholders and to the friendly, but expensive, investment banker who recommended the foolish purchases."
– Warren Buffett
In general, buybacks can be a good capital allocation decision for businesses that go on to compound their earnings for many years. These are typically companies with high returns on invested capital, consistent growth, and strong balance sheets.
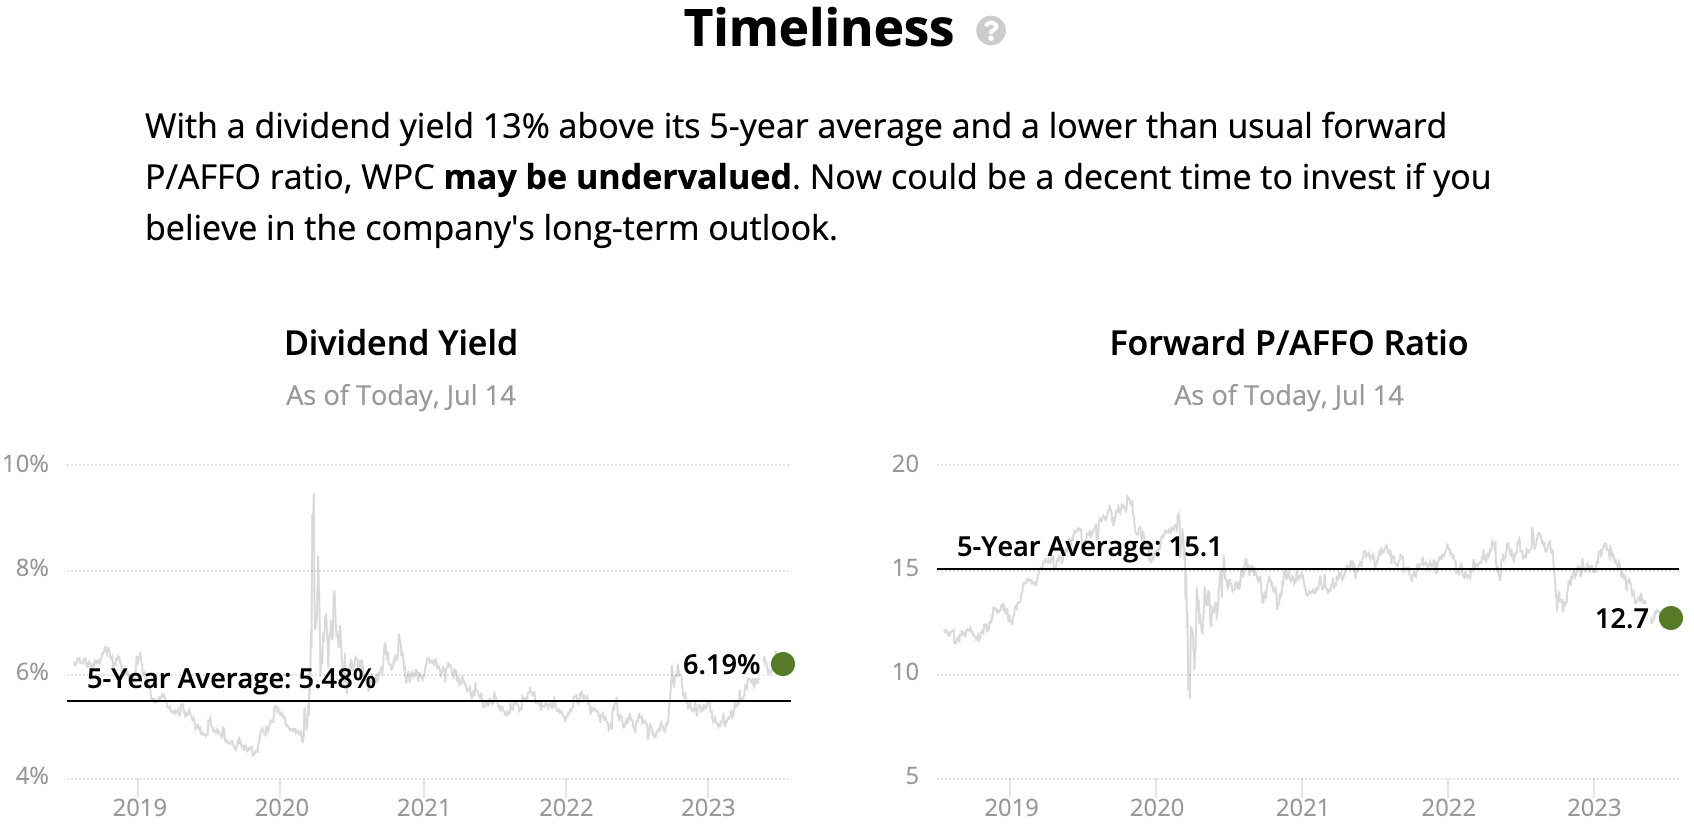
Financial Ratio #10: Timeliness
Since 1970, dividends have made up 40% of total returns for stocks in the U.S. and Europe, per data from JPMorgan cited by The Wall Street Journal. (Total return measures capital gains, plus dividends received.)
Given the importance of dividends to a portfolio’s returns, evaluating a stock’s historical dividend yield range can help gauge whether or not a stock’s current price appears reasonable.
If a company's dividend remains safe and its long-term outlook appears unchanged, snapping up shares when they trade at a relatively high yield can be an attractive proposition.
Unique to Simply Safe Dividends, our Timeliness indicator measures how far above or below a stock’s current yield is compared to its five-year average yield, with the idea being that yields tend to revert to their long-term averages over time.
The chart below on the left plots daily dividend yield values over the last five years for W.P. Carey, a diversified REIT.
You can see that the stock's yield has ranged from a low near 4.5% to a high of about 6.5%. Income investors evaluating W.P. Carey might consider buying the stock when its yield is near its five-year average or higher.
Source: Simply Safe Dividends
Dividend Safety Scores Analyze the Most Important Financial Ratios
Financial ratio analysis is only worthwhile if it produces actionable insights. In regards to dividend investing, we are focused on using financial ratios to identify high quality stocks that pay safe, growing dividends.
To help with that effort, we created a Dividend Safety Score system that has avoided 97% of dividend cuts in real-time since its inception in 2015.
Our analyst team assesses dividend risk in part by scrutinizing payout ratios, debt levels, free cash flow generation, recession performance, near-term business trends, and more.
Sticking with companies that earn Safe or Very Safe Dividend Safety Scores can help investors find high quality dividend growth stocks and avoid riskier sources of income.
You can learn more about Dividend Safety Scores, view their track record, and learn how to apply them to your portfolio here.
Closing Thoughts on Financial Ratios
Having at least a basic understanding of the most important financial ratios for dividend investing is prudent.
While investing involves plenty of unknowns, investors can improve their chances of spotting great businesses and avoiding mistakes when armed with an understanding of financial ratios.
There's no obligation, but Simply Safe Dividends offers a free trial if you'd like to review financial charts, Dividend Safety Scores, and more for any stock. You can learn more here.