
AT&T (T) and Verizon (VZ) are two classic dividend income plays. However, not all dividend yields are created equal – differences in growth rates, competitive advantages, balance sheet health, and more can significantly alter the riskiness of a dividend and a stock’s total return potential. While T and VZ might have looked fairly similar several years ago, they have started to diverge in a pretty significant way.
To view the full dividend data we used to analyze VZ and T, please click here.
Business Overview
VZ is the biggest wireless service provider in the US, with its 4G LTE network available to over 98% of the US population. Wireless operations account for about 70% of total sales and 95%+ of operating profits (30%+ operating margin business). Wireline accounts for the remainder and primarily includes broadband video and data and traditional voice services.
T’s business was more balanced between wireline and wireless. In fiscal year 2014, wireless accounted for 56% of its sales and 75% of its income (low-to-mid 20% operating margin). Wireline made up the remainder of the business. However, the company’s $49 billion bid for DirecTV was recently approved and will make T the largest pay TV provider in the world once it closes. T hopes bundling internet, mobile, and TV on one bill will separate it from competitors. Its exposure to wireless will be reduced.
Stock Performance
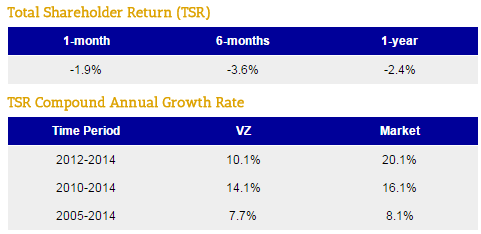
Not surprisingly, VZ failed to keep up with the market over the past three years, compounding at 10% compared to the market’s 20% CAGR. Over longer periods, VZ has performed about in line with the market.
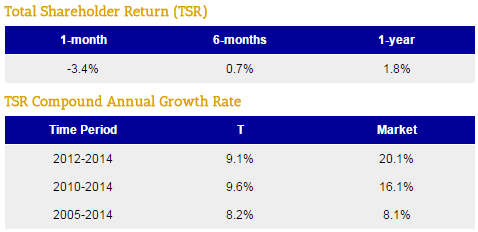
T’s long-term performance has been similar to VZ’s, although it has faired significantly worse over the last five years (9.6% CAGR vs VZ’s 14.1% CAGR):
Dividend Analysis
We analyze 25+ years of dividend data and 10+ years of fundamental data to understand the safety and growth prospects of a dividend. A stock’s long-term dividend and fundamental data can all be seen here.
Dividend Safety Score
Our Safety Score answers the question, “Is the current dividend payment safe?” We look at factors such as current and historical EPS and FCF payout ratios, debt levels, free cash flow generation, industry cyclicality, ROIC trends, and more.
Verizon
VZ scored an impressive 94 Safety Score, suggesting its dividend is safer than 94% of all other dividend stocks.
Factors contributing positively to VZ’s score are its large size, generally stable industry (sales were flattish during the recession), modest payout ratios, and consistent returns on invested capital. While VZ’s debt load jumped with its $130 billion deal to acquire the remaining 45% of Verizon Wireless, it is still a very healthy business.
One of the first places to look to evaluate a dividend’s safety is the payout ratio. Earnings are generally more volatile than free cash flow, so we like to look at the free cash flow payout ratio in addition to the EPS payout ratio. Over the trailing twelve months, VZ’s free cash flow payout ratio is a healthy 49%, consistent with levels observed over the past decade.
To Read the Full Analysis, Subscribe or Sign In

Leave A Comment